Simulations were configured with observed forcing fields from the
Bondville 1998 dataset. The simulations iterated several times over
one year of data; the comparisons below represent results of the fifth
iteration.
In the table below, observations (when available) are in black.
Noah-MP Version 1.1 results are in blue. Noah Version 3.4.1 results are in
red. Click on the thumbnail images in the table
below for full-sized images.
|
| Jan-Feb-Mar (Q1) |
Apr-May-Jun (Q2) |
Jul-Aug-Sep (Q3) |
Oct-Nov-Dec (Q4) |
Sensible Heat Flux (HFX)
Average diurnal cycle |
 |
 |
 |
 |
| |
|
|
|
Sensible Heat Flux (HFX)
Scatter Plot |
 |
 |
 |
 |
| |
|
|
|
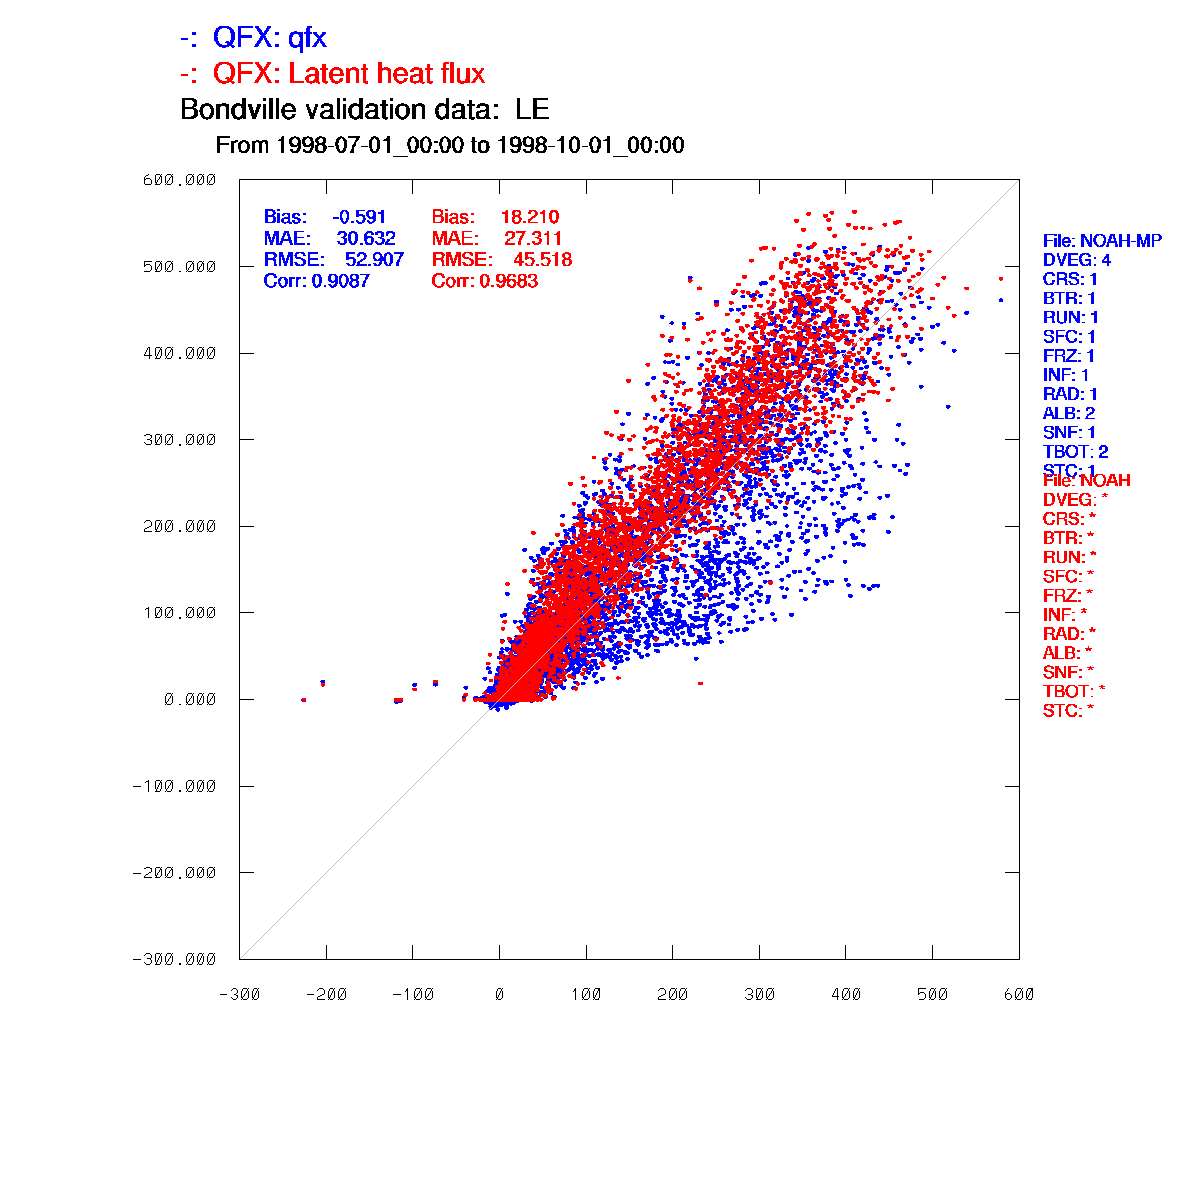
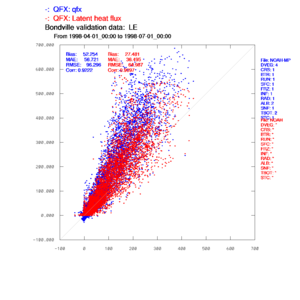
Latent Heat Flux (QFX)
Average diurnal cycle |
 |
 |
 |
 |
| |
|
|
|
Latent Heat Flux (QFX)
Scatter Plot |
 |
 |
 |
 |
| |
|
|
|
Soil Heat Flux (SSOIL)
Average diurnal cycle |
 |
 |
 |
 |
|
Direct Soil Evaporation (EDIR)
Average diurnal cycle |
 |
 |
 |
 |
| No observations for validation. |
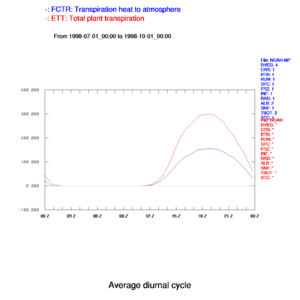
Total Plant Transpiration (ETT)
Average diurnal cycle |
 |
 |
 |
 |
| No observations for validation. |
Skin Temperature (T1)
Average diurnal cycle |
 |
 |
 |
 |
| |
|
|
|
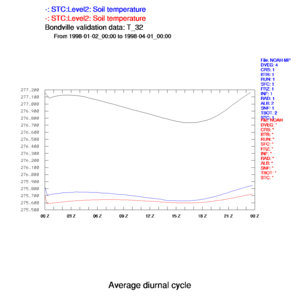
Soil Temperature, Layer 1 (ST1)
Average diurnal cycle |
 |
 |
 |
 |
|
We are comparing the temperature observation at 4 cm below the surface, to the Noah layer temperature from surface to 10 cm.
|
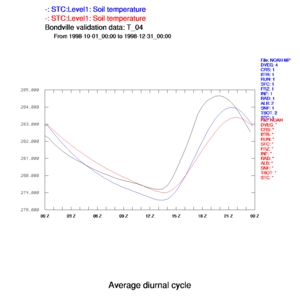
Soil Temperature, Layer 2 (ST2)
Average diurnal cycle |
 |
 |
 |
 |
|
We are plotting the observations at 32 cm below the surface, and the Noah layer from 10 to 40 cm below ground (i.e., centered at 25 cm below ground).
|
Soil Temperature, Layer 2 (ST2)
Unaveraged time series |
 |
 |
 |
 |
|
Plotting the observations at 32 cm below the surface, and the Noah layer from 10 to 40 cm below ground (i.e., centered at 25 cm below ground).
|
Soil Temperature, Layer 3 (ST3)
Unaveraged time series |
 |
 |
 |
 |
|
Comparing observations at 64 cm below ground to the Noah layer 40 to 100 cm below ground (i.e., centered at 70 cm below ground).
|
Soil Moisture, Layer 1 (SM1)
Unaveraged time series |
 |
 |
 |
 |
|
Observations (in black) seem to have fairly low precision.
|
Soil Moisture, Layer 2 (SM2)
Unaveraged time series |
 |
 |
 |
 |
|
Observations (in black) seem kind of suspect to me.
|
Soil Moisture, Layer 3 (SM3)
Unaveraged time series |
 |
 |
 |
 |
|
Observations (in black) seem suspect to me.
|