Simulations were configured with observed forcing fields from the
Bondville 1998 dataset. In version 3.0-update1, the parameters of
background albedo, background z0, and greeness fraction are
tunable by setting values taken to be valid in the middle of each
month of the year. In version 3.1-prerelease, background albedo,
background z0, and background emissivity are interpolated
between climatological minimum and maximum values, based on the
provided greeness fraction. The greenness fraction is tunable by
setting values taken to be valid in the middle of each month of the
year.
These experiments have been configured to use the same climatological
cycle of greenness fraction. Background albedo and background
z0 for version 3.0-update1 have been tuned to provide
values close to those computed in version 3.1-prerelease. Version
3.0-update1 has constant background emissivity, while version
3.1-prerelease varies background emissivity according to the
climatological cycle of greeness fraction.
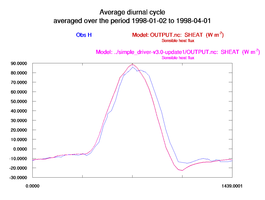
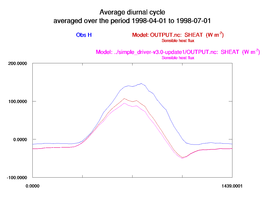
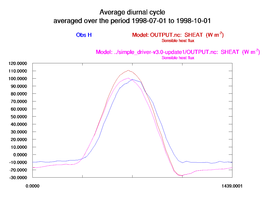
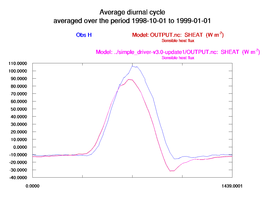
In the table below, observations (when available) are in blue.
Version 3.0-update1 results are in magenta. Version 3.1-prerelease
results are in dark red. Click on the thumbnail images-compare3-0 in the table
below for full-sized images-compare3-0.
|
| Jan-Feb-Mar (Q1) |
Apr-May-Jun (Q2) |
Jul-Aug-Sep (Q3) |
Oct-Nov-Dec (Q4) |
Sensible Heat Flux (HFX)
Average diurnal cycle |
 |
 |
 |
 |
| Cold season -- very little difference during Q1 |
Slight improvement during Q2, with somewhat less of an underestimate of the sensible heat flux during the daytime |
New version has ~100 W m-2 overestimate of sensible heat flux during daytime in Q3
| Cold season -- very little difference during Q4 |
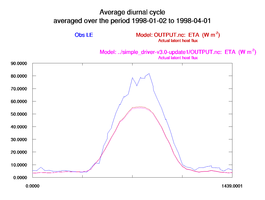
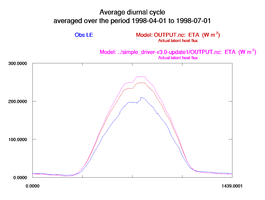
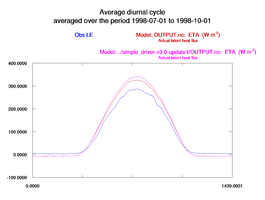
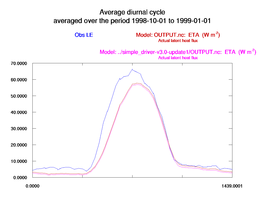
Latent Heat Flux (QFX)
Average diurnal cycle |
 |
 |
 |
 |
| Cold season -- little difference during Q1. We still underestimate the daytime latent heat flux by ~30 W m-2 |
Slight improvement, reducing an 80 W m-2 by about 20 W m-2 |
Again, a slight improvement during Q3 |
Cold season -- little difference during Q4. Our underestimate of the latent heat flux is still ~10 W m-2 |
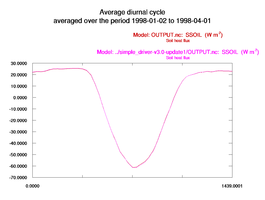
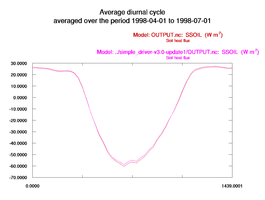
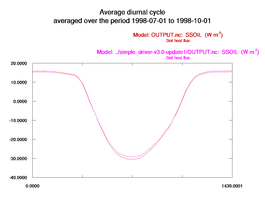
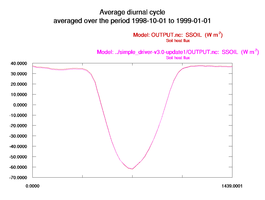
Soil Heat Flux (SSOIL)
Average diurnal cycle |
 |
 |
 |
 |
|
Little difference in the soil heat flux between the two versions, throughout the year. No observations for validation.
|
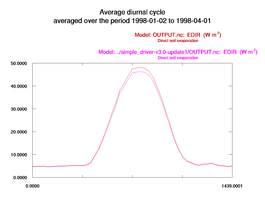
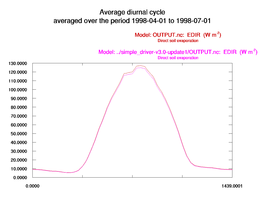
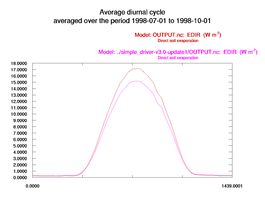
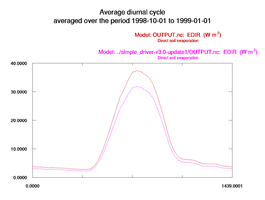
Direct Soil Evaporation (EDIR)
Average diurnal cycle |
 |
 |
 |
 |
|
The new version produces a slight increase (on the order of a few W m-2) in the direct soil evaporation throughout the year. No observations for validation.
|
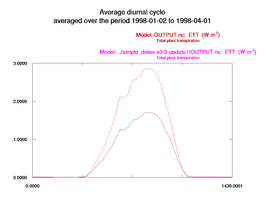
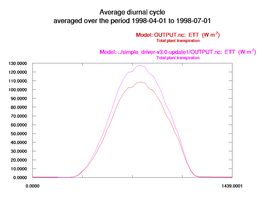
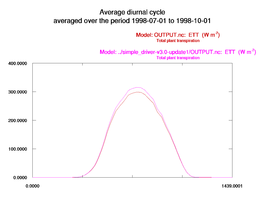
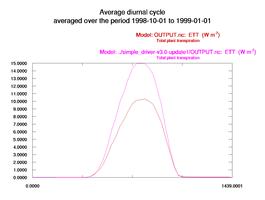
Total Plant Transpiration (ETT)
Average diurnal cycle |
 |
 |
 |
 |
|
The new version reduces plant transpiration throughout the year, by a few W m-2 during the colder seasons, and 20-30 W m-2 during the warmer seasons. No observations for validation.
|
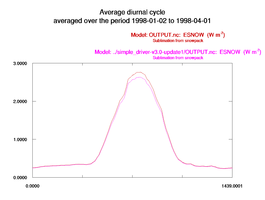
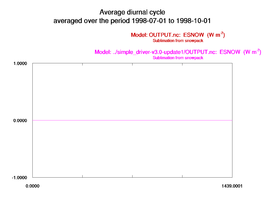
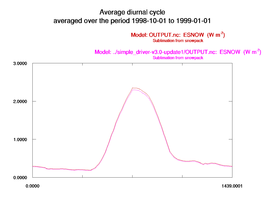
Evaporation from Snow (ESNOW)
Average diurnal cycle |
 |
 |
 |
 |
|
Versions are quite close. The new version produces a very slight increase in the evaporation from snow. No observations for validation.
|
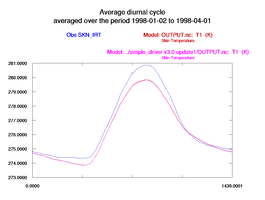
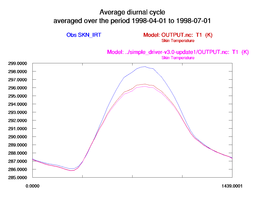
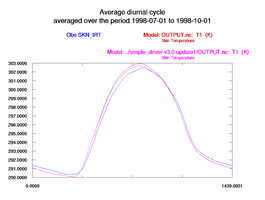
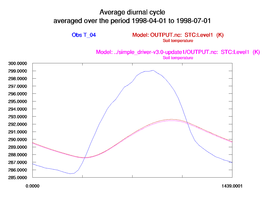
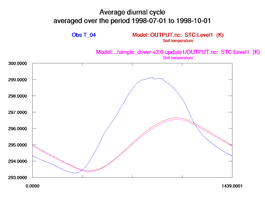
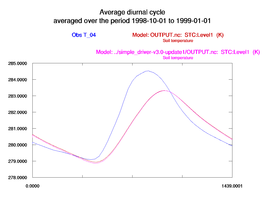
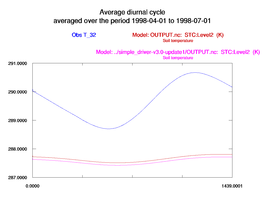
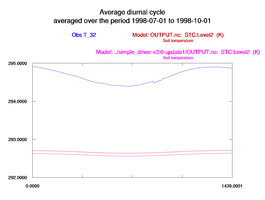
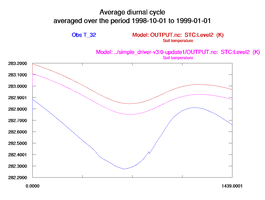
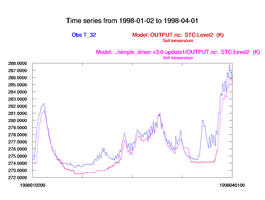
Skin Temperature (T1)
Average diurnal cycle |
 |
 |
 |
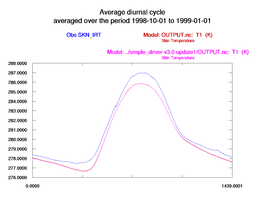 |
| Cold season results are very similar between versions |
New version slightly improves average diurnal cycle in Q2 |
New version overestimates daytime skin temperature in Q3 |
Cold season results are very similar between versions |
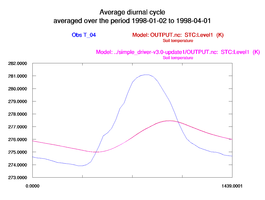
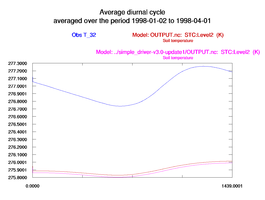
Soil Temperature, Layer 1 (ST1)
Average diurnal cycle |
 |
 |
 |
 |
|
Little difference between the two versions. The Noah diurnal cycle in the top soil layer is considerably damped compared to the observations. We are comparing the temperature observation at 4 cm below the surface, to the Noah layer temperature from surface to 10 cm.
|
Soil Temperature, Layer 2 (ST2)
Average diurnal cycle |
 |
 |
 |
 |
|
A little deeper down, Noah diurnal cycle is still damped compared to observations. We are plotting the observations at 32 cm below the surface, and the Noah layer from 10 to 40 cm below ground (i.e., centered at 25 cm below ground). Noah is a couple of degrees colder than observations throughout the first three quarters.
|
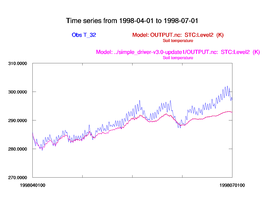
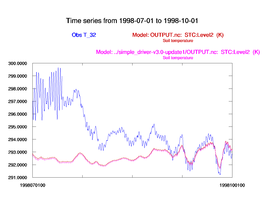
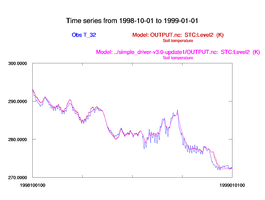
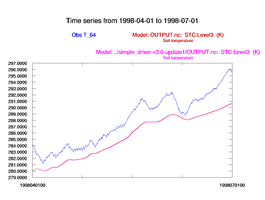
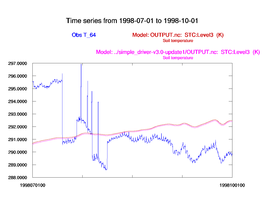
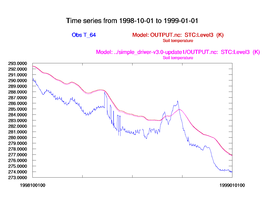
Soil Temperature, Layer 2 (ST2)
Unaveraged time series |
 |
 |
 |
 |
|
Plotting the observations at 32 cm below the surface, and the Noah layer from 10 to 40 cm below ground (i.e., centered at 25 cm below ground). Results during the hottest part of the year (tail end of Q2 and first half or so of Q1) are notably bad. Other times of the year, temperature values and trends look pretty good.
|
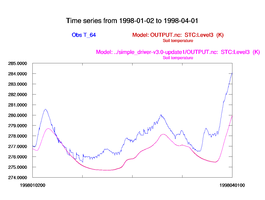
Soil Temperature, Layer 3 (ST3)
Unaveraged time series |
 |
 |
 |
 |
|
Comparing observations at 64 cm below ground to the Noah layer 40 to 100 cm below ground (i.e., centered at 70 cm below ground).
|
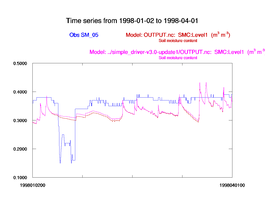
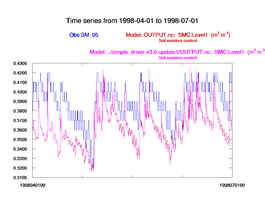
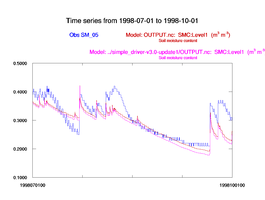
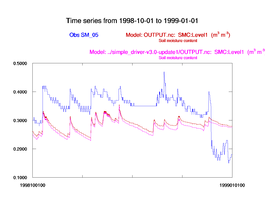
Soil Moisture, Layer 1 (SM1)
Unaveraged time series |
 |
 |
 |
 |
|
Apart from the first quarter, the new version seems to be a little moister than the older version at level 1, which appears to be a slight improvement as compared to observations. Observations (in blue) seem to have fairly low precision.
|
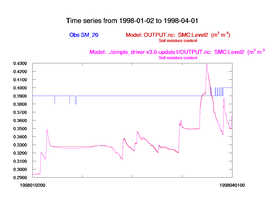
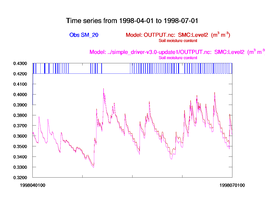
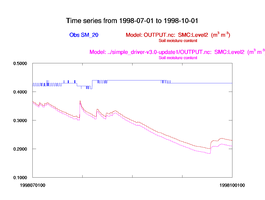
Soil Moisture, Layer 2 (SM2)
Unaveraged time series |
 |
 |
 |
 |
|
Observations (in blue) seem kind of suspect to me. Overall the new version is a little moister than the older version at level 2.
|
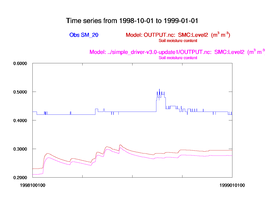
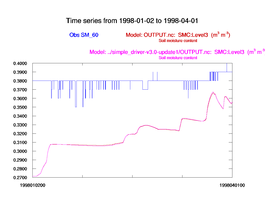
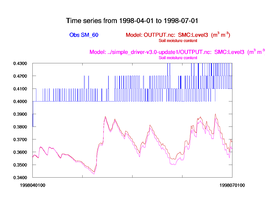
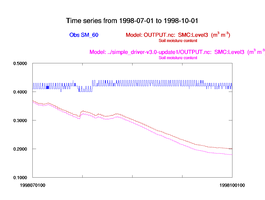
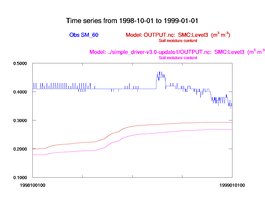
Soil Moisture, Layer 3 (SM3)
Unaveraged time series |
 |
 |
 |
 |
|
Observations (in blue) seem suspect to me. As with the two levels nearer the surface, results with the new code are a little moister than with the old code.
|


