Simulations were configured with observed forcing fields from the
Bondville 1998 dataset.
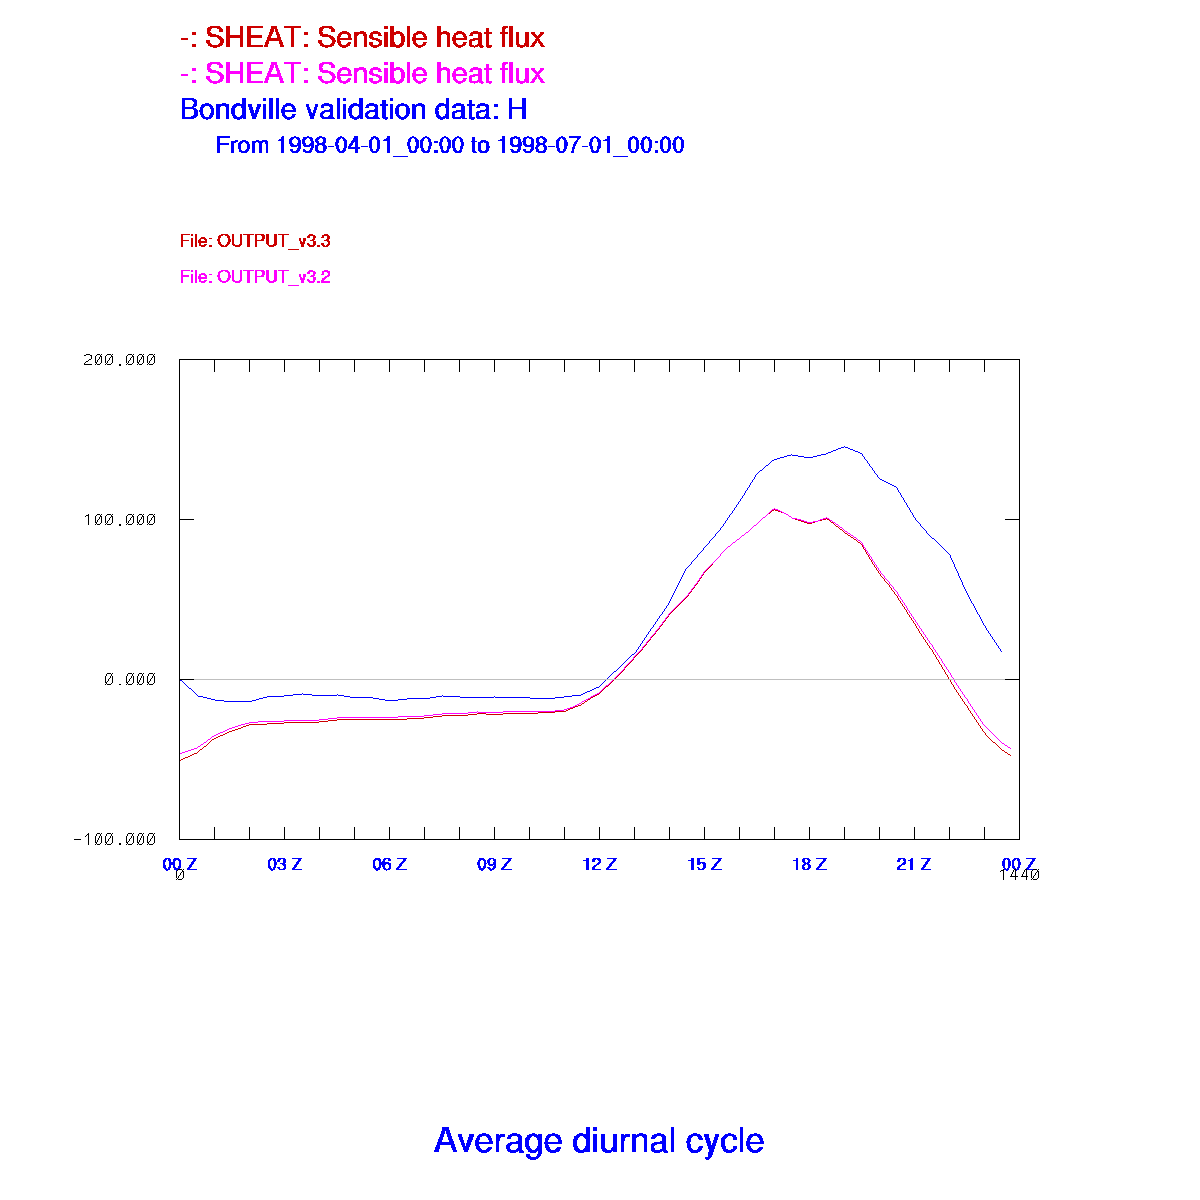
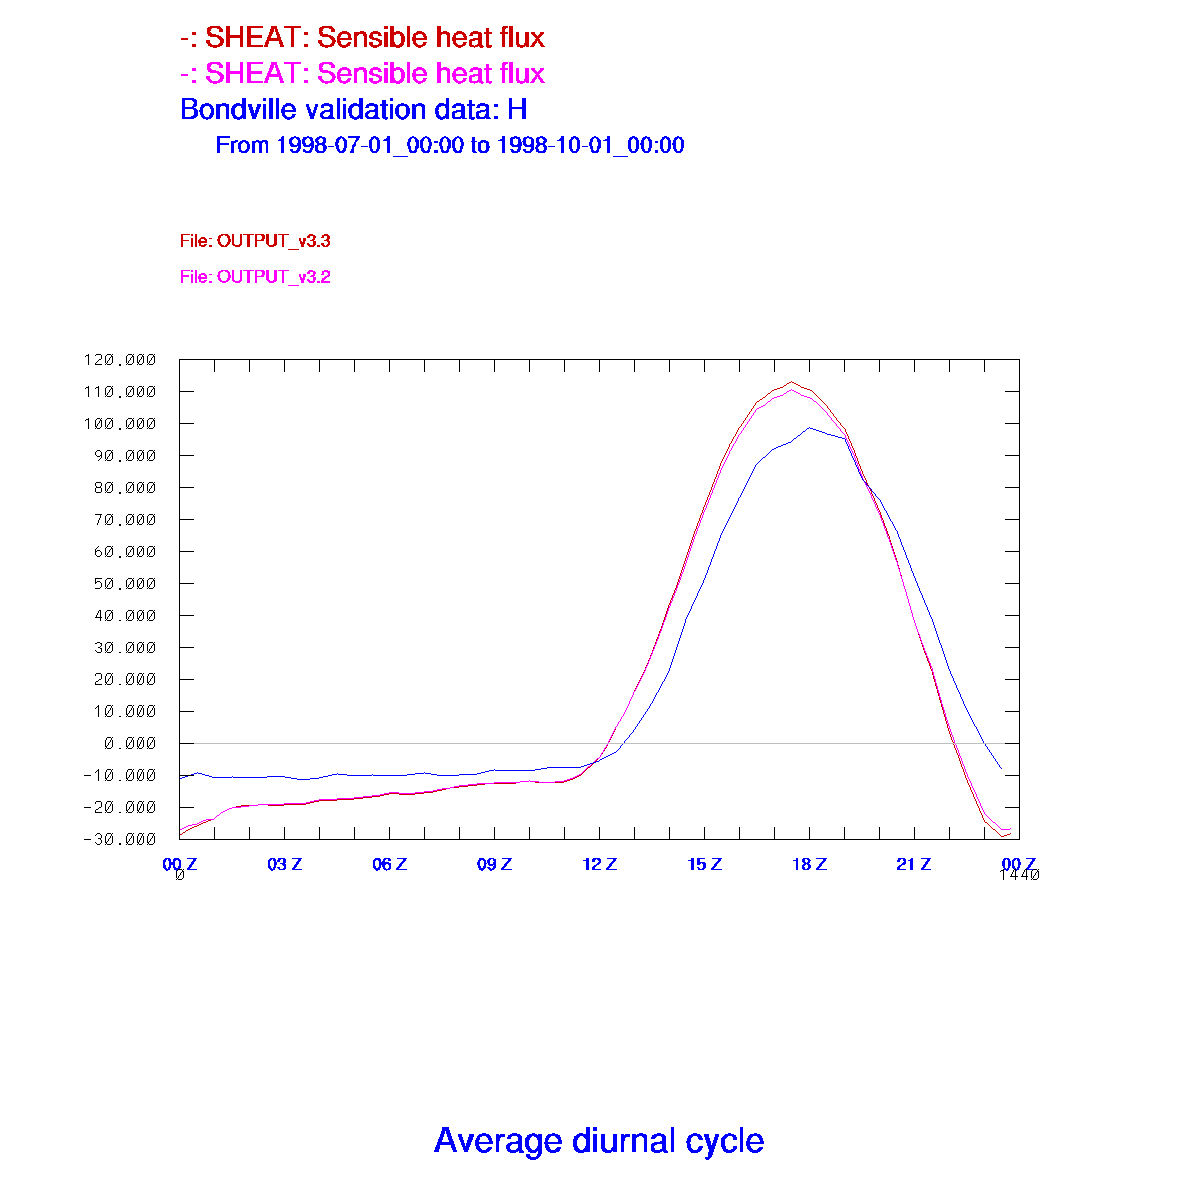
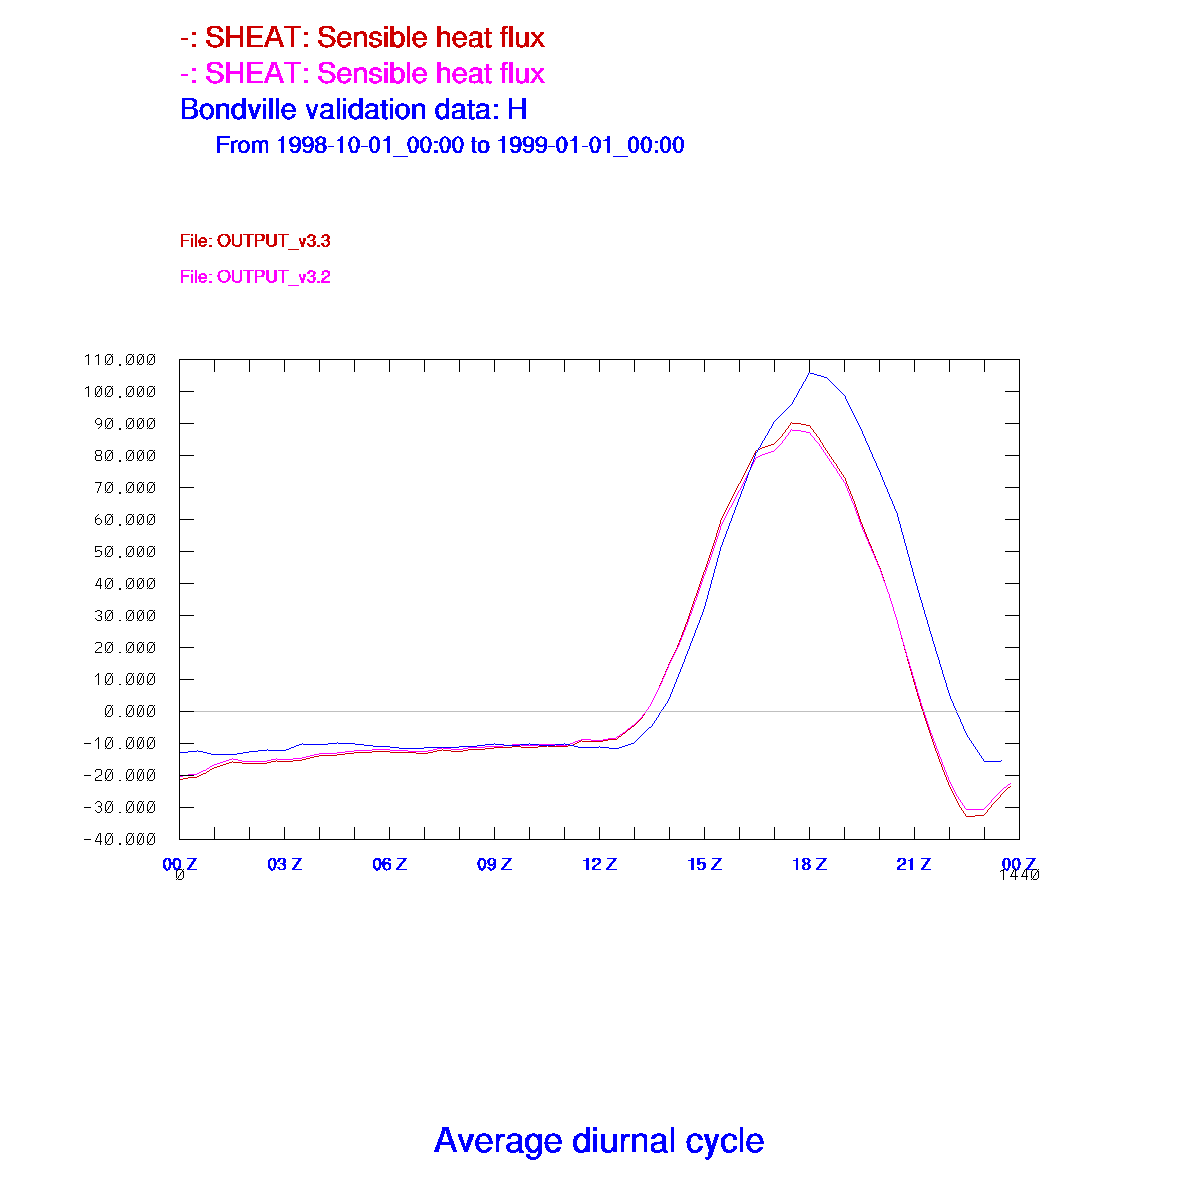
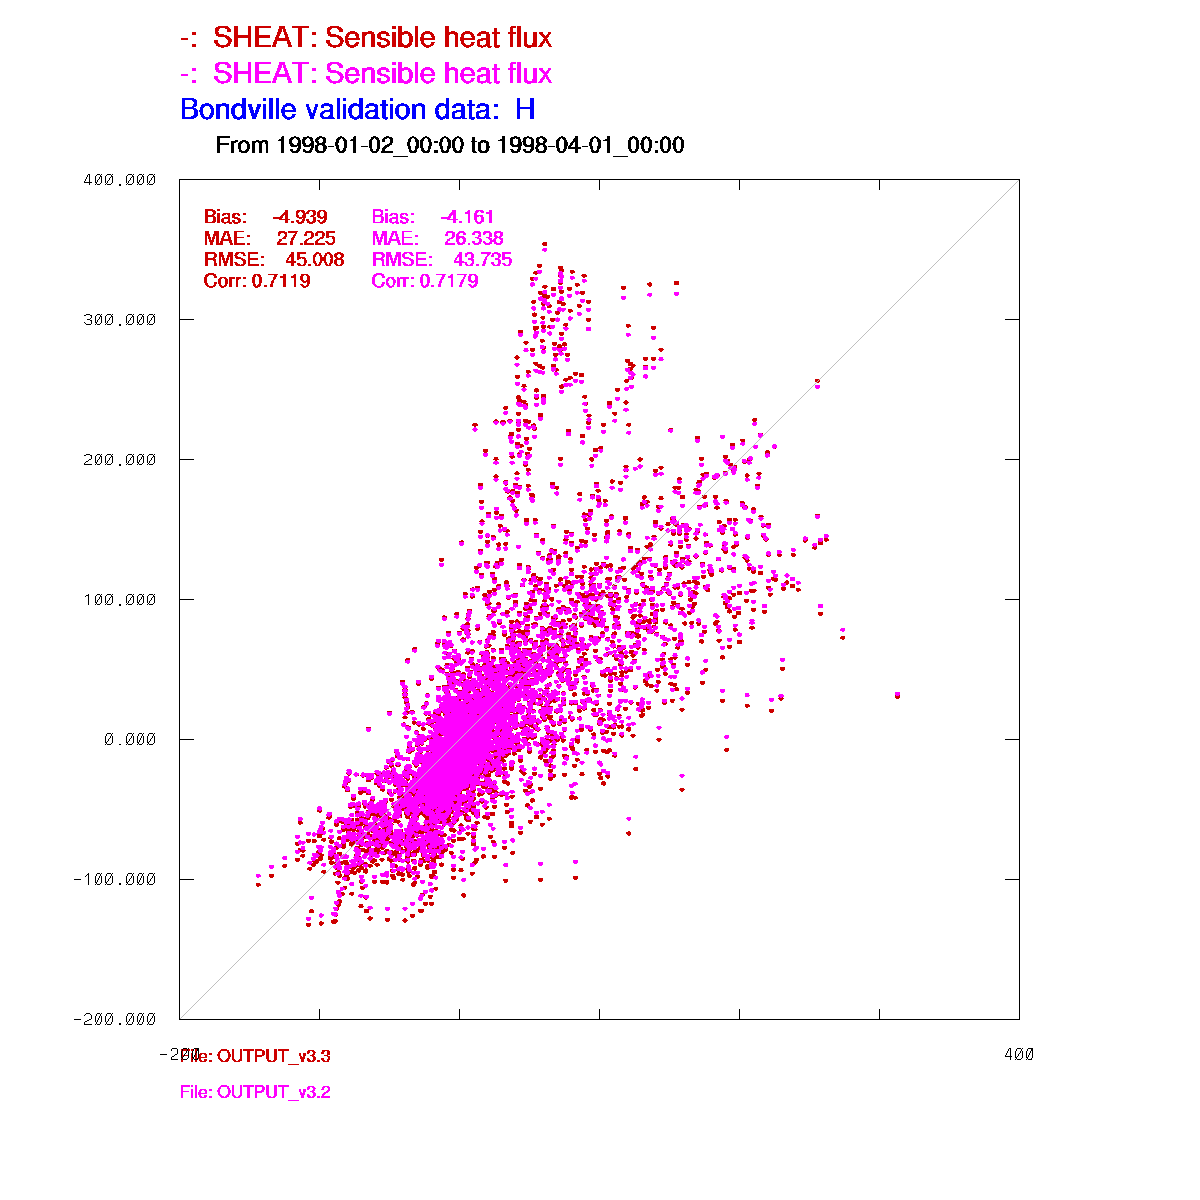
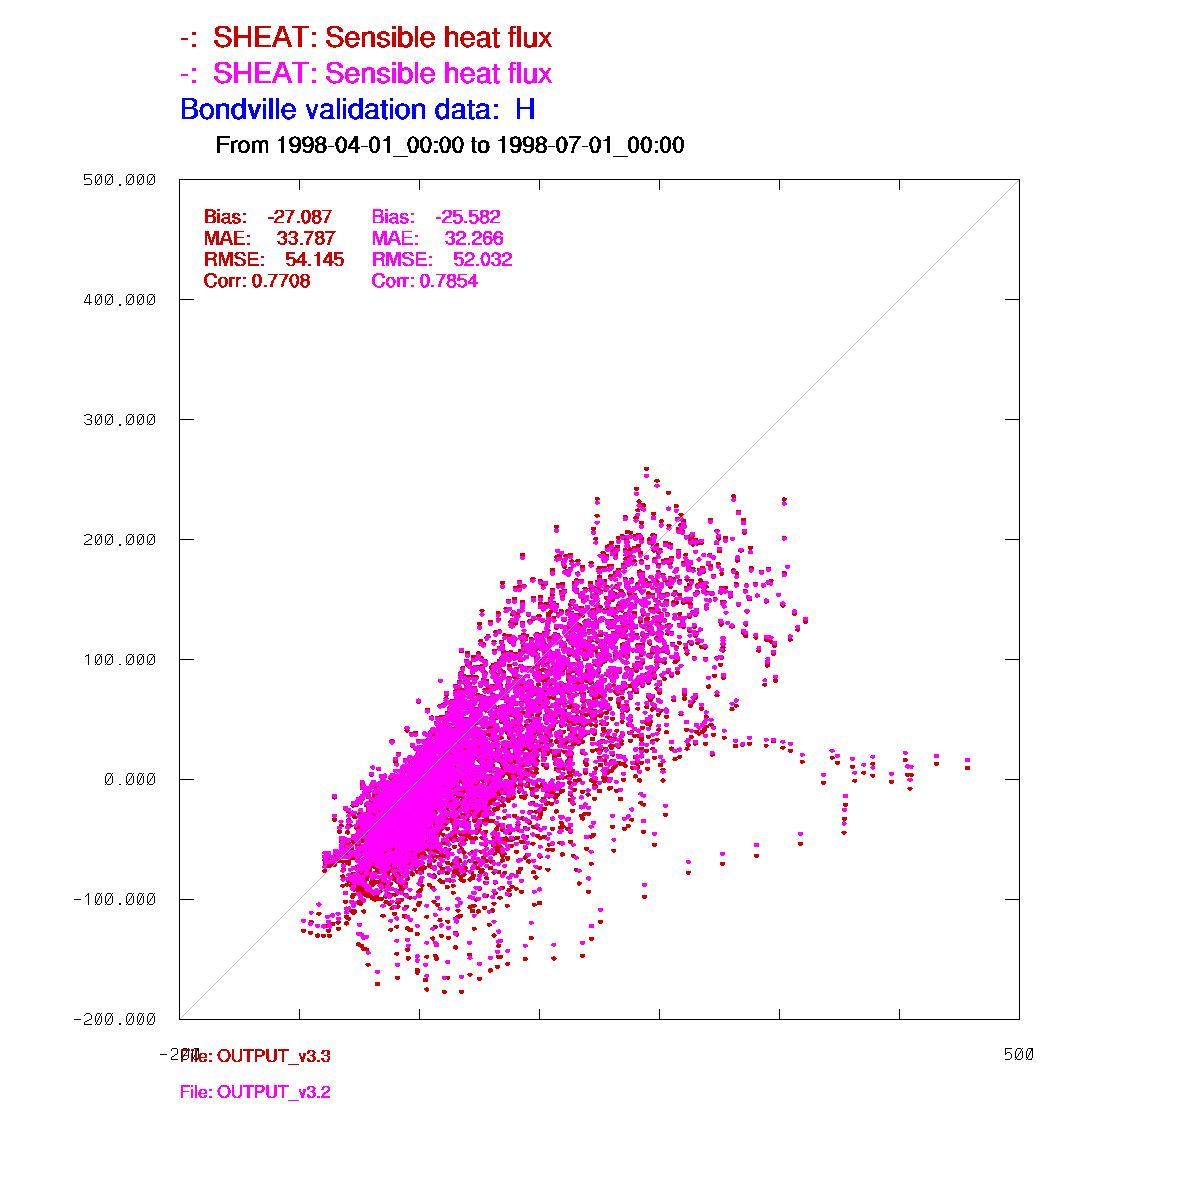
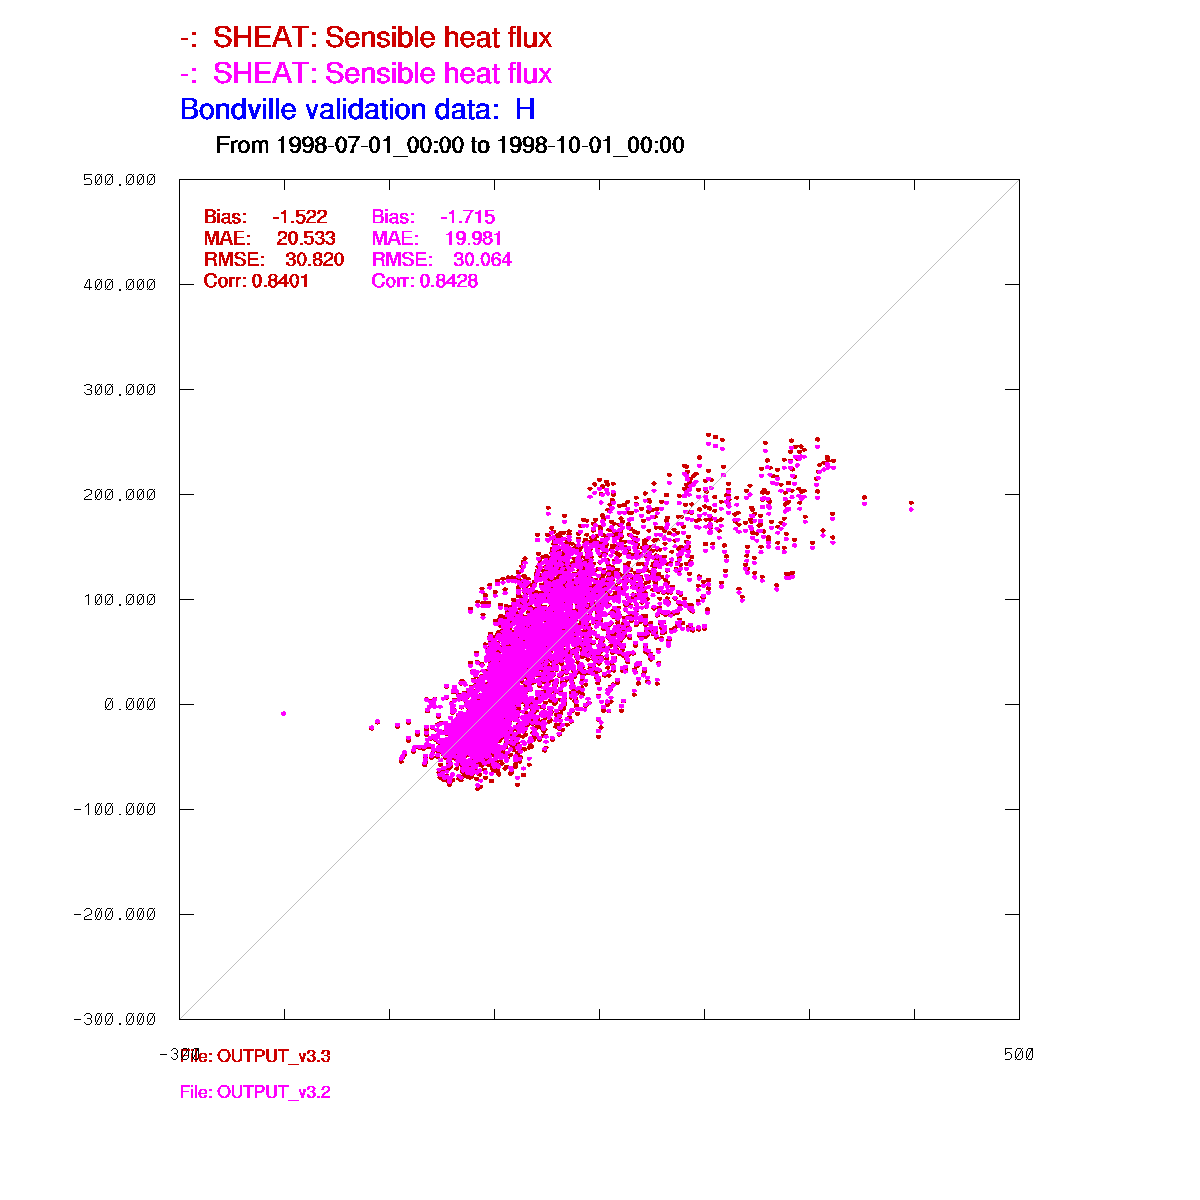
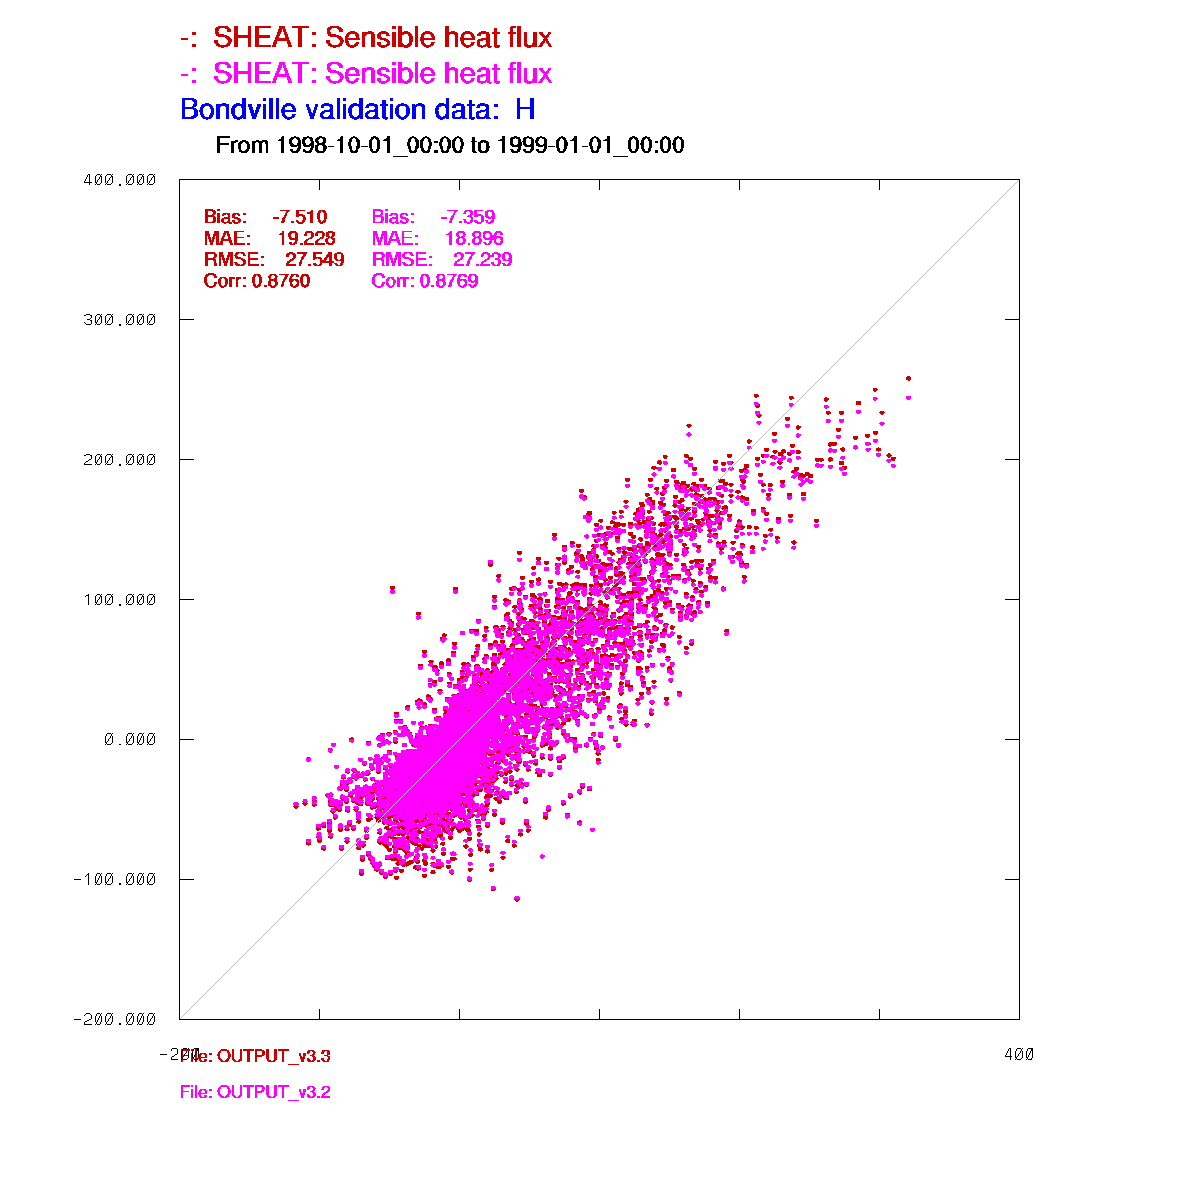
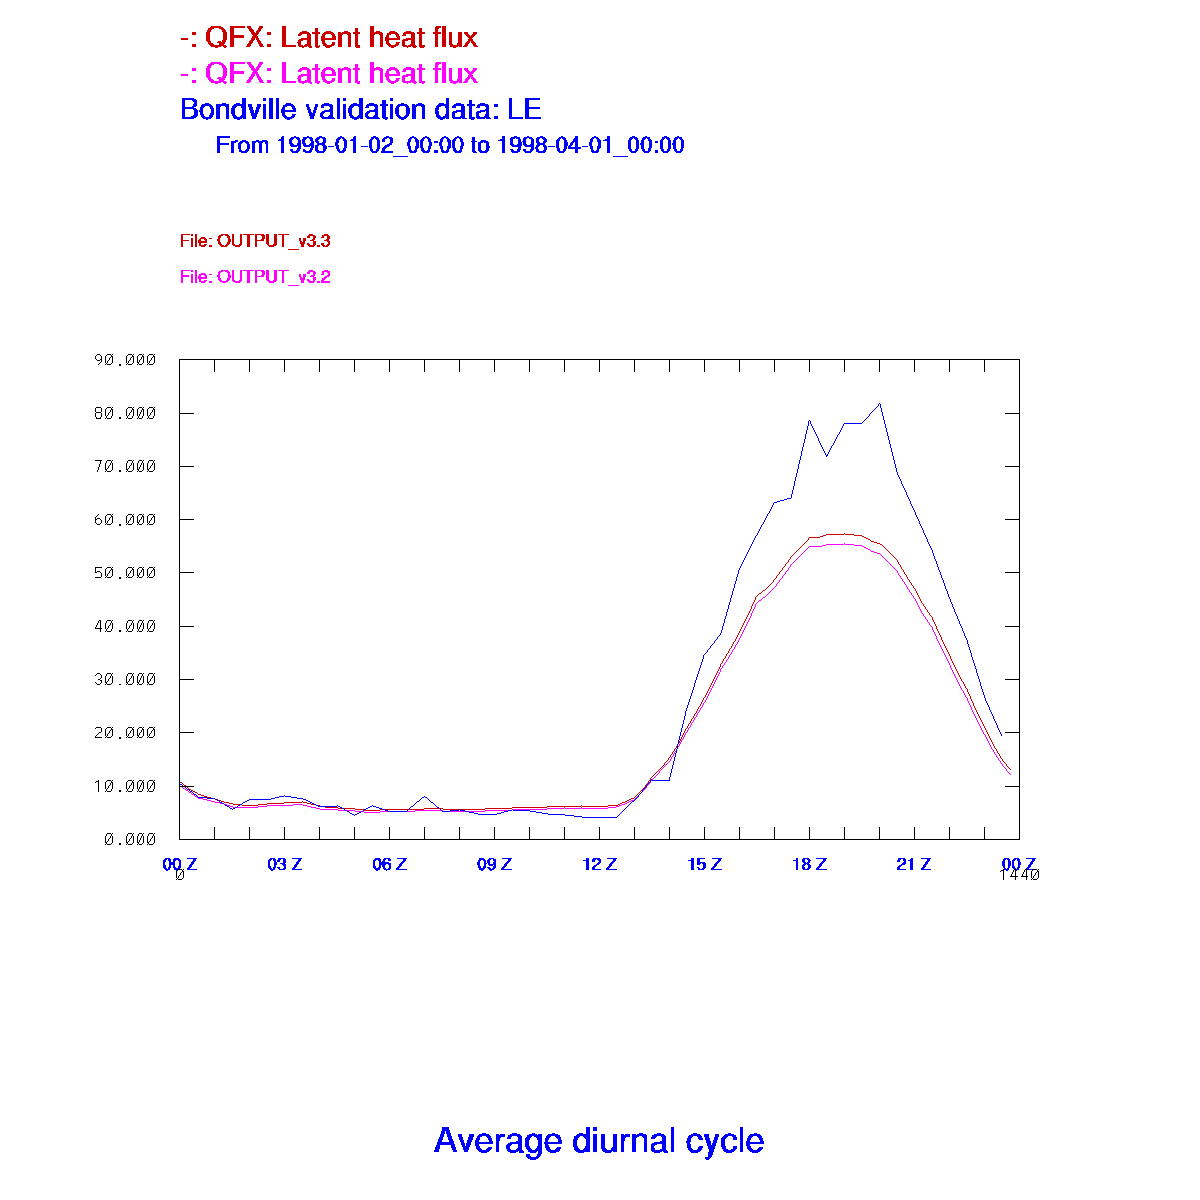
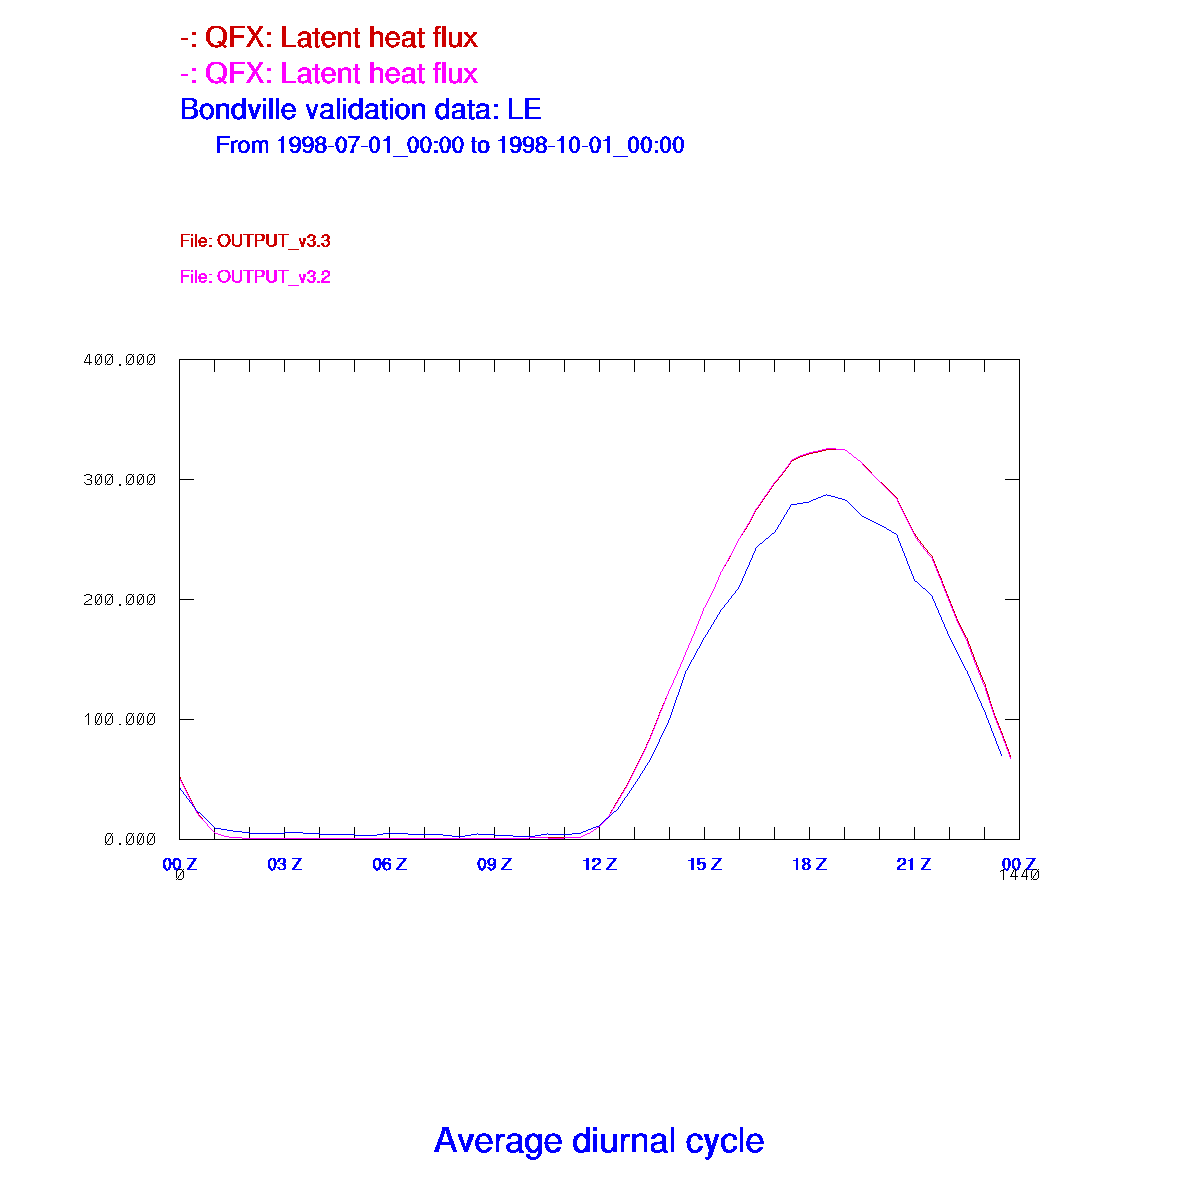
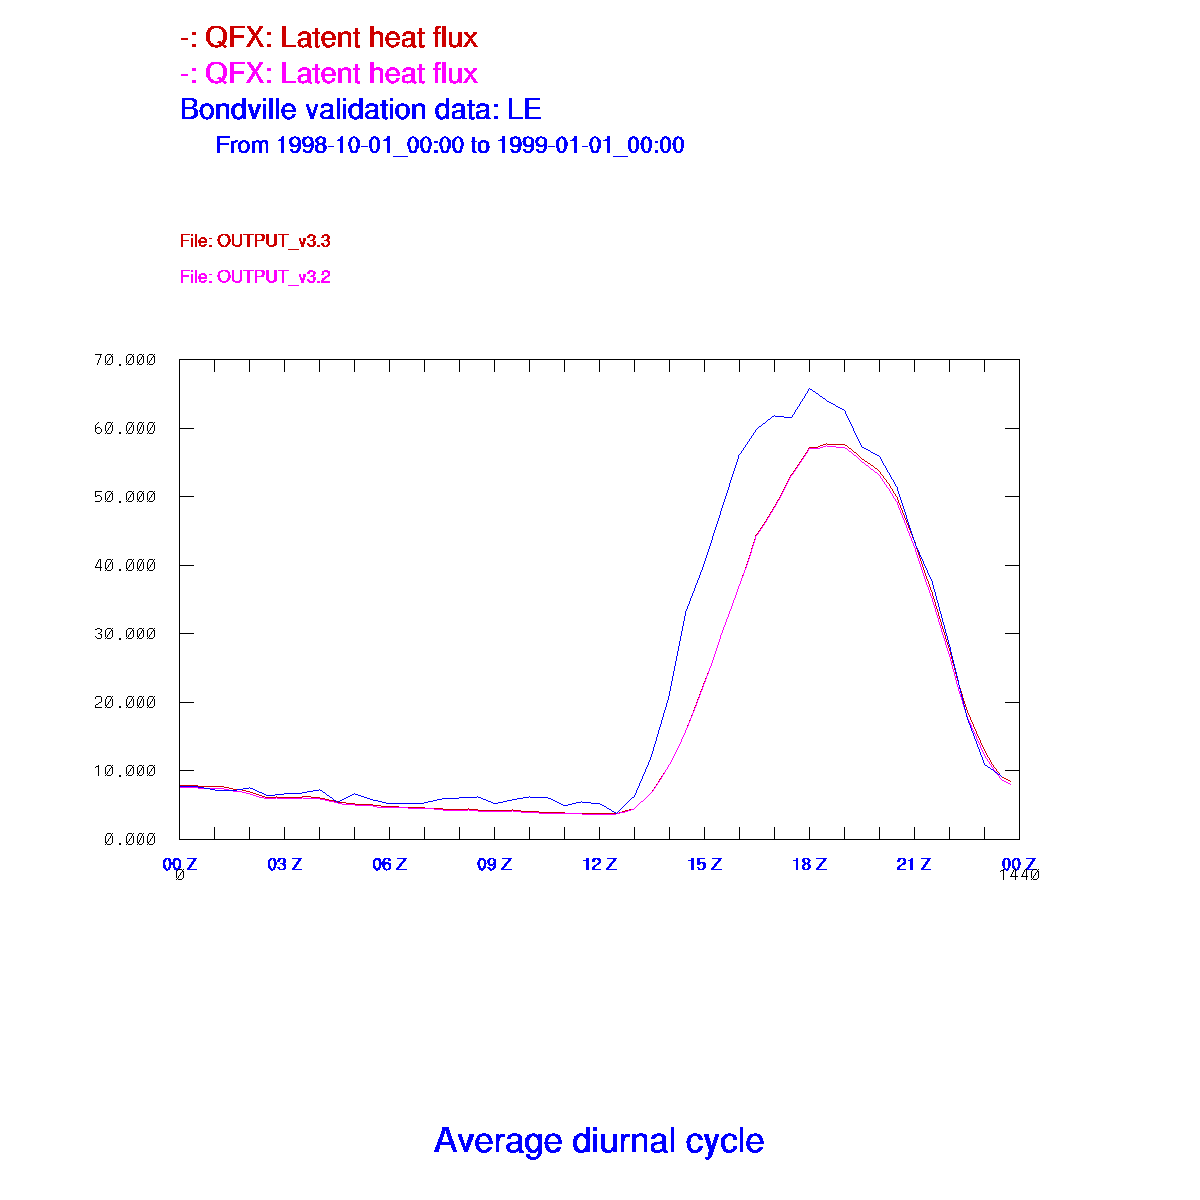
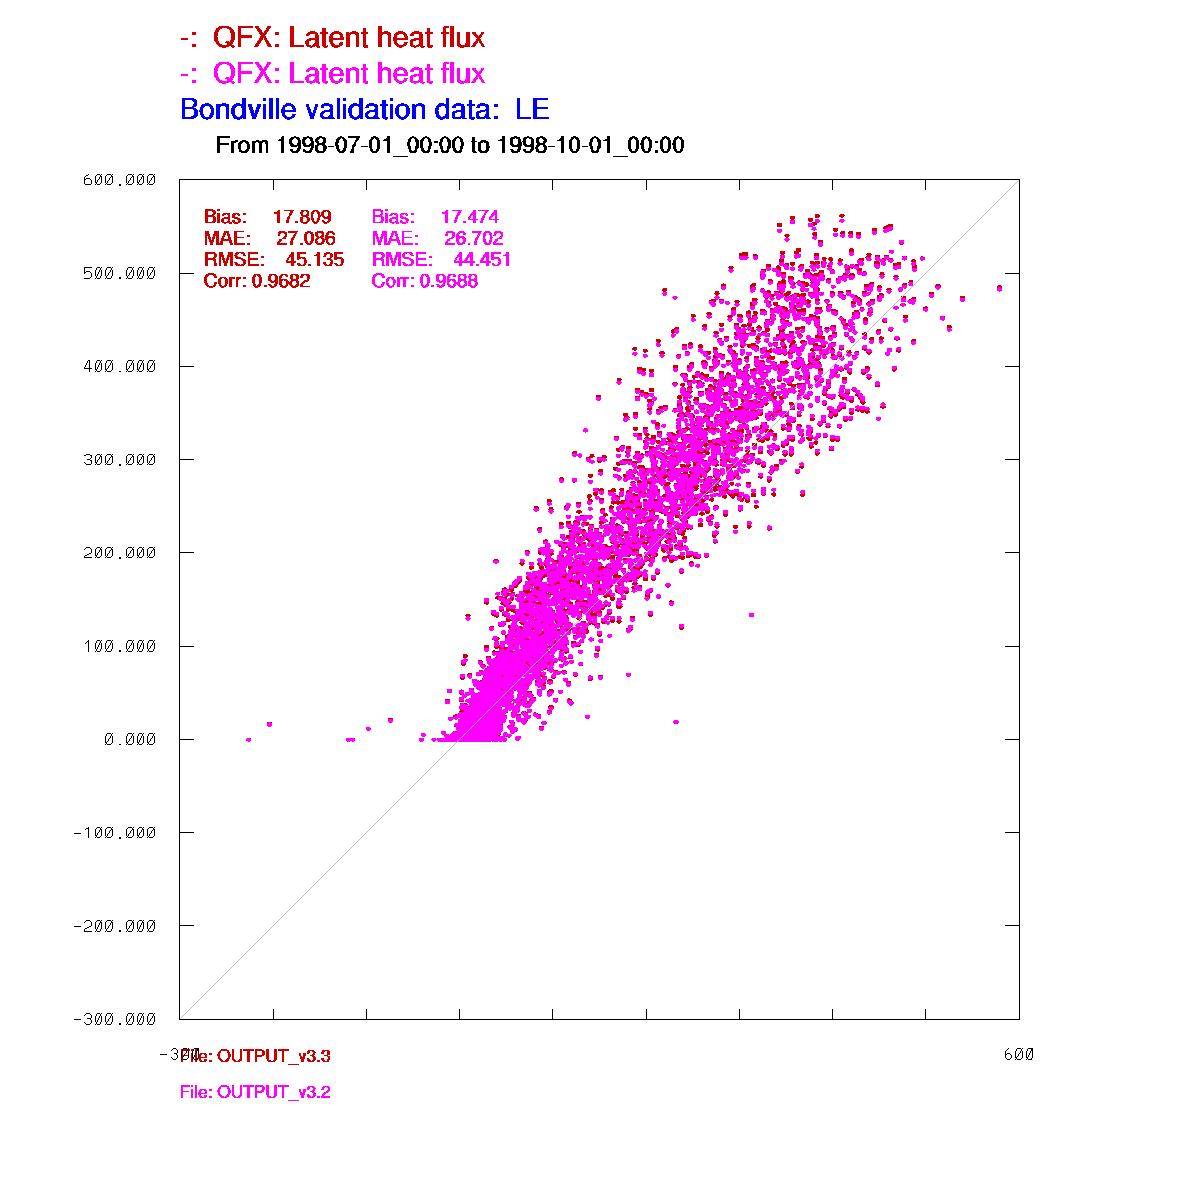
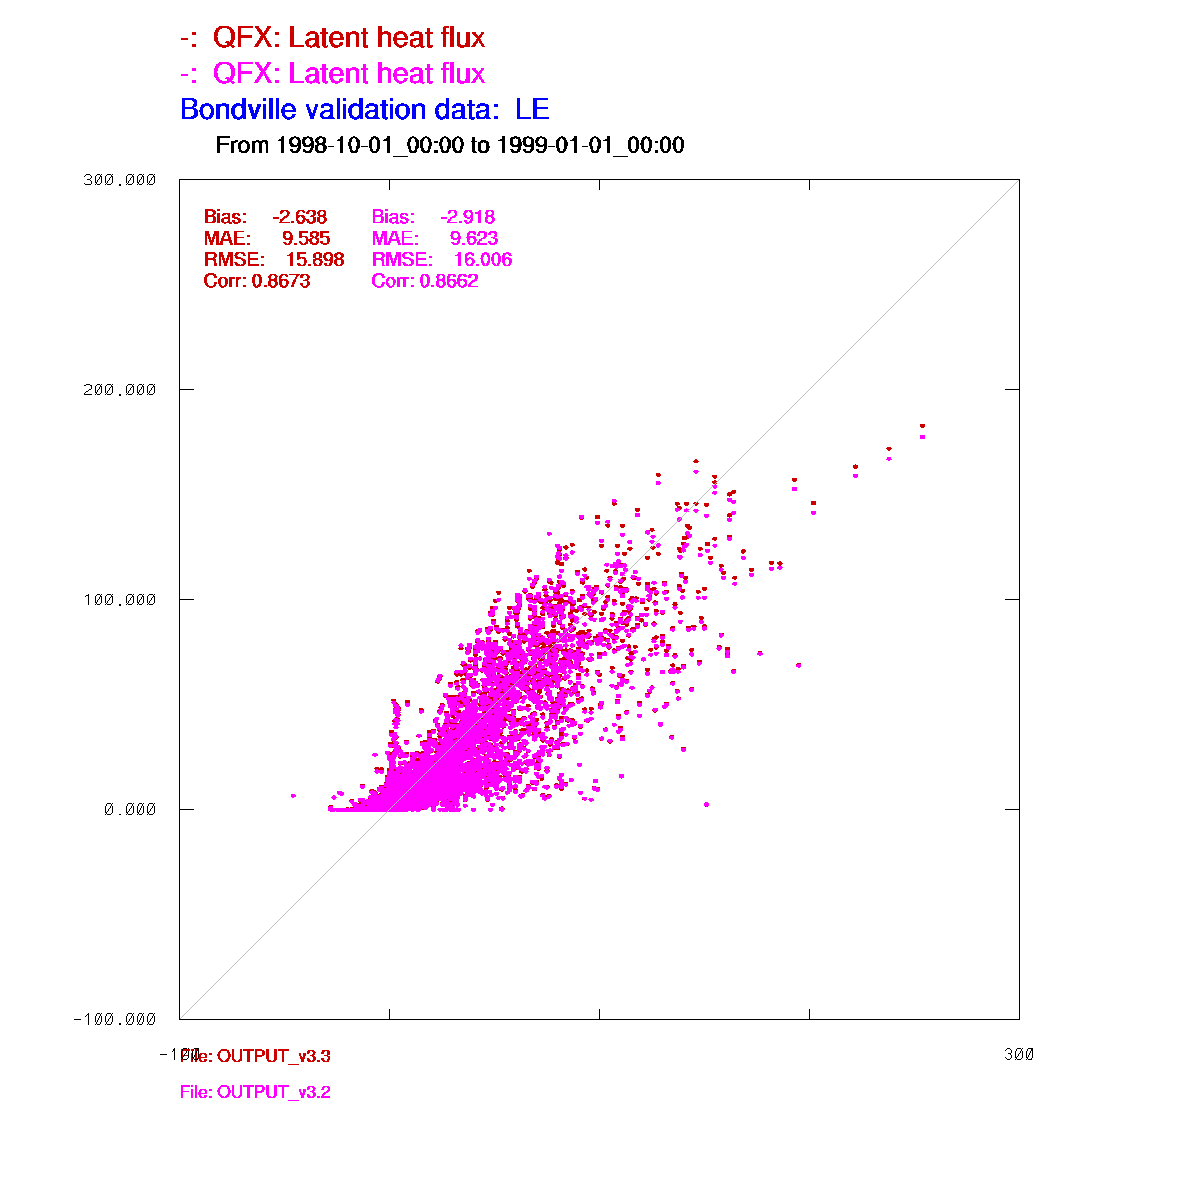
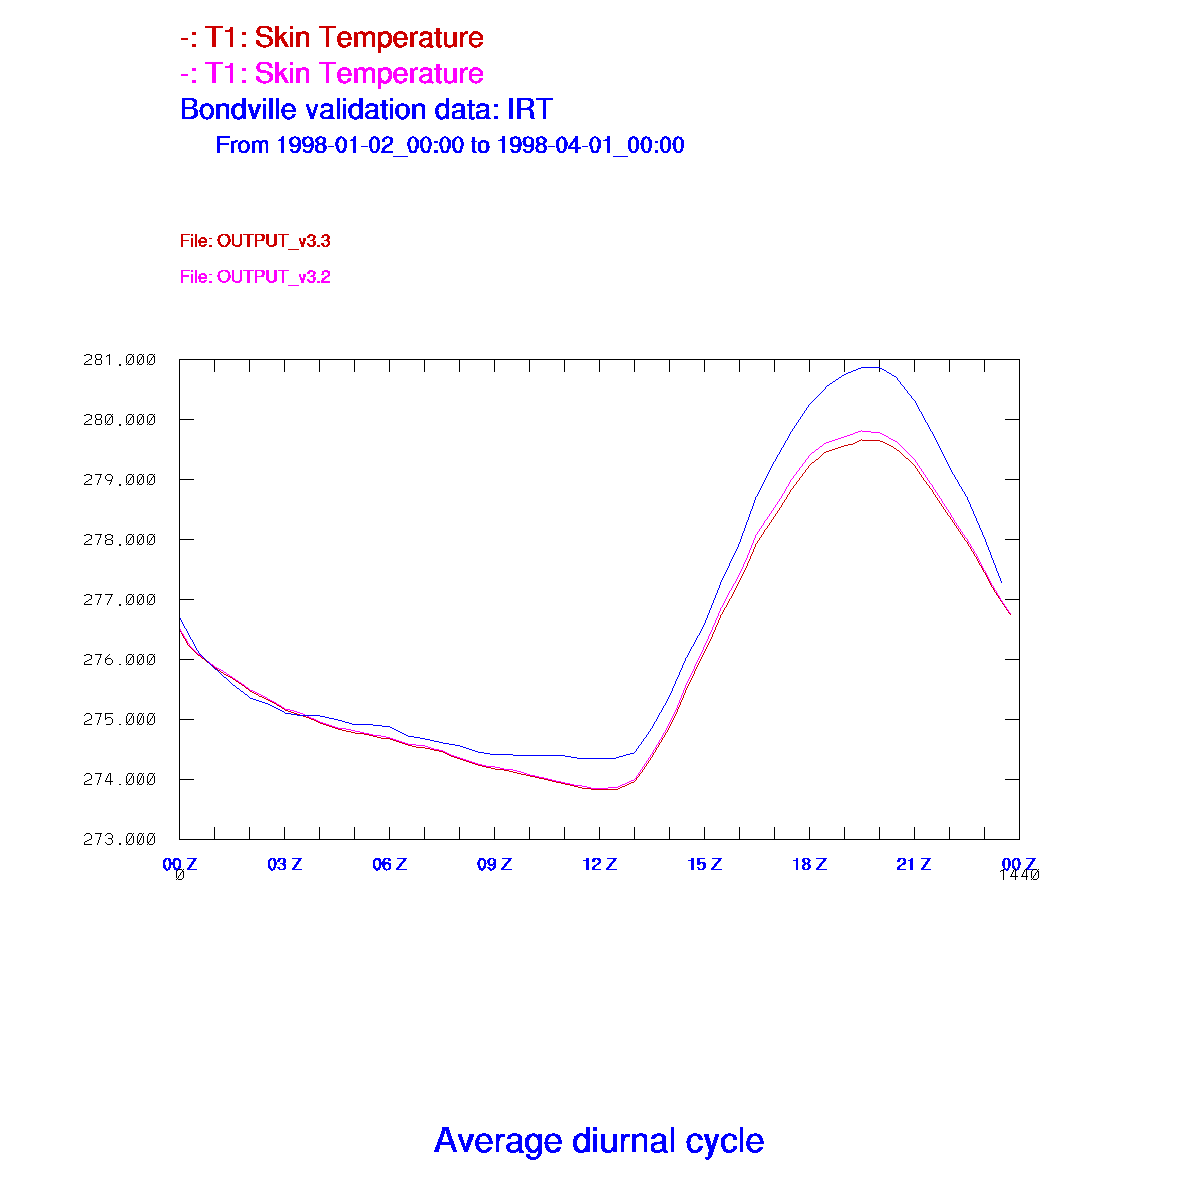
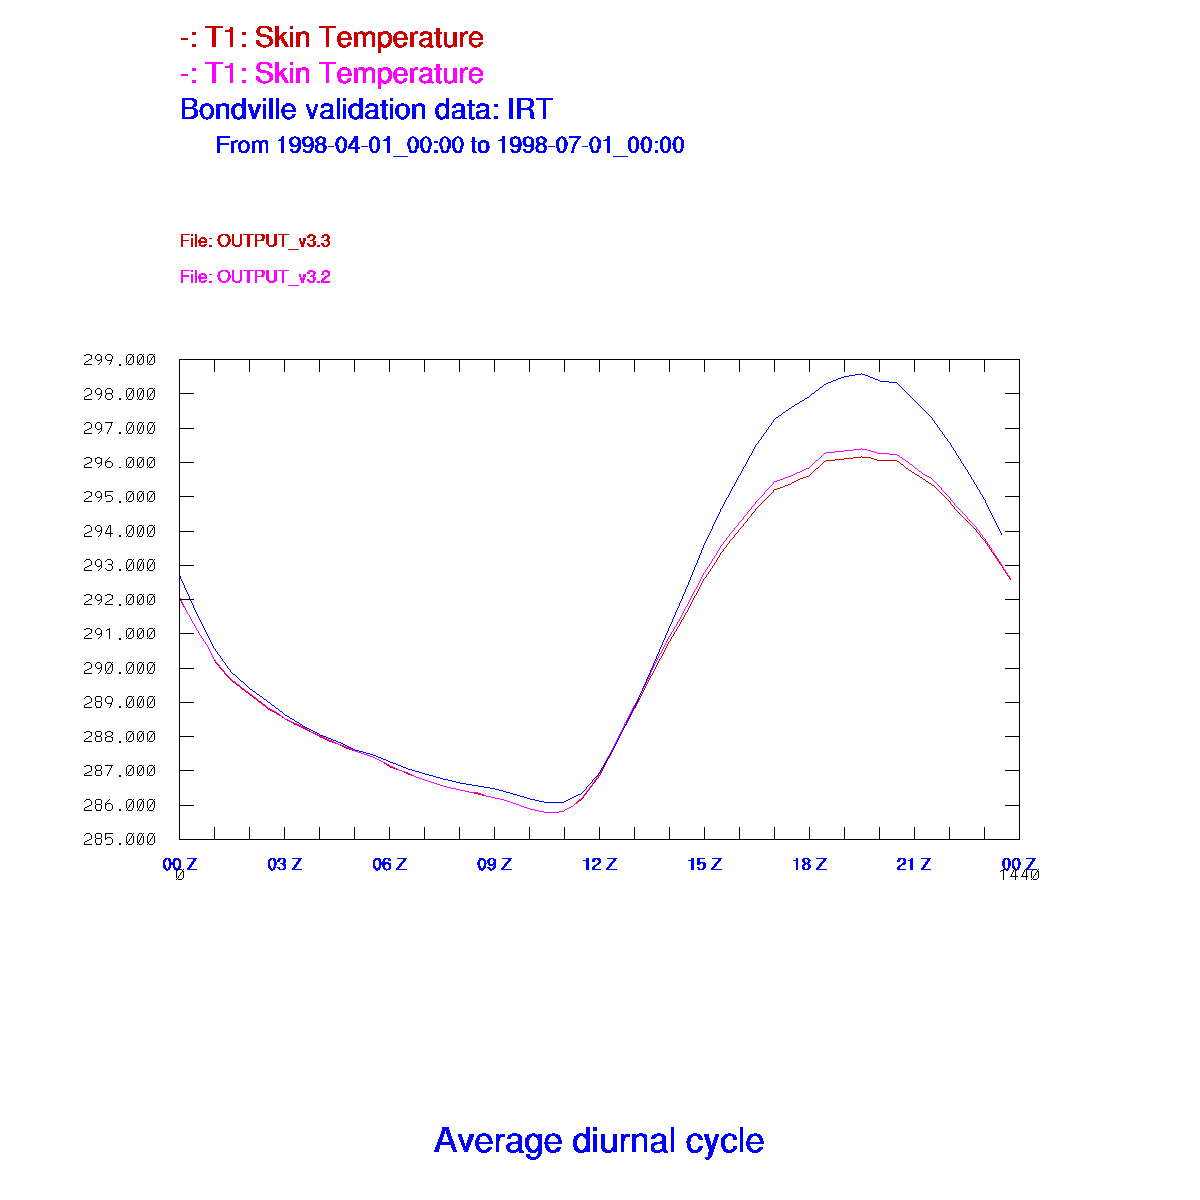
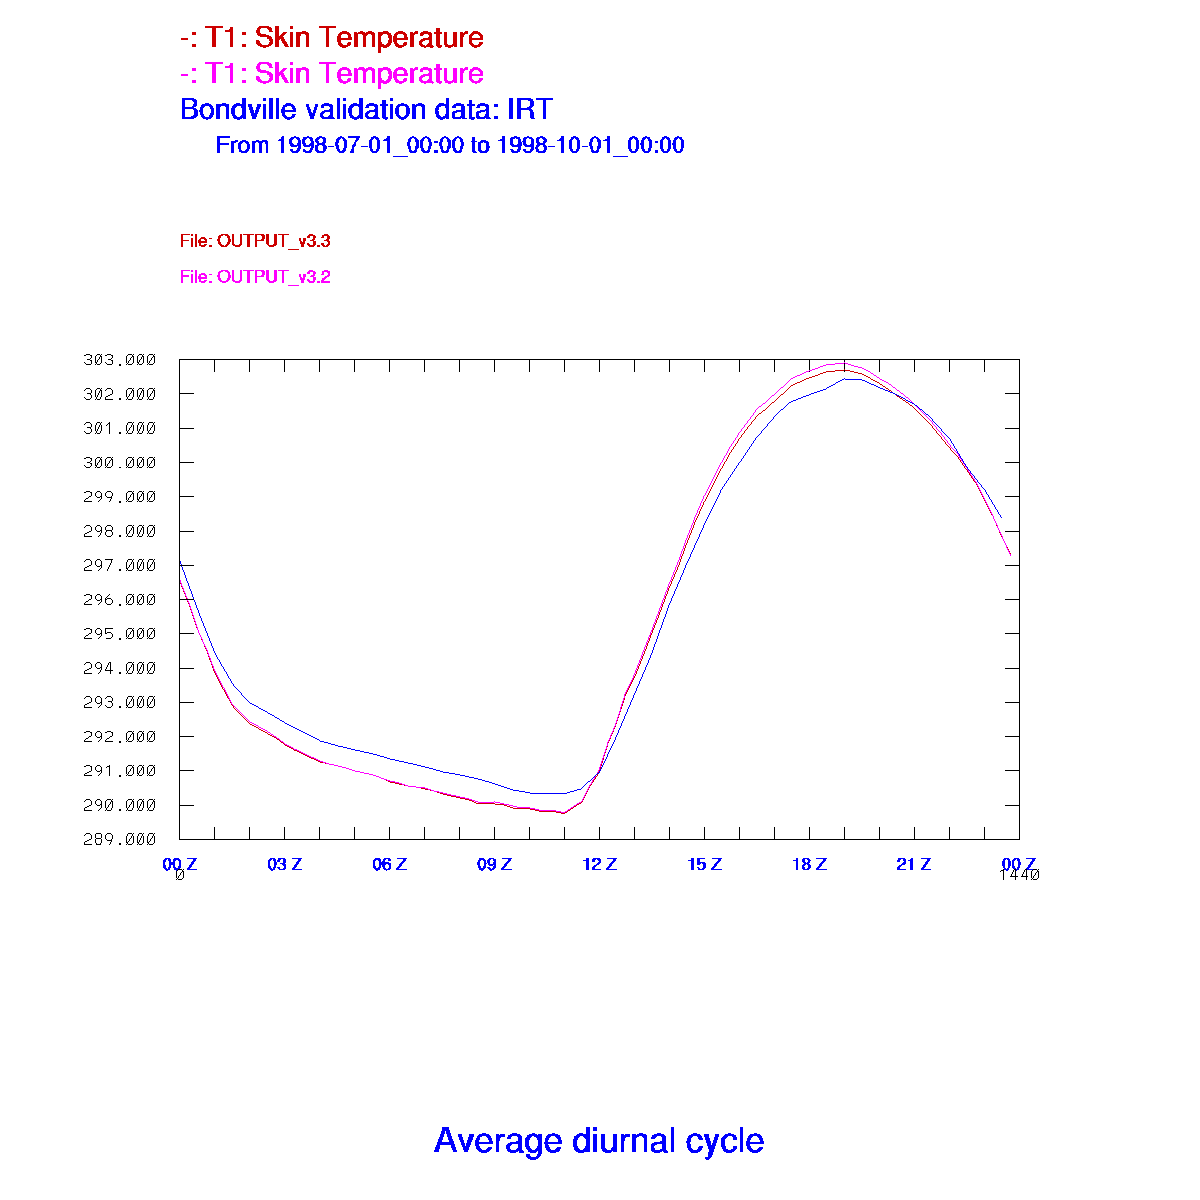
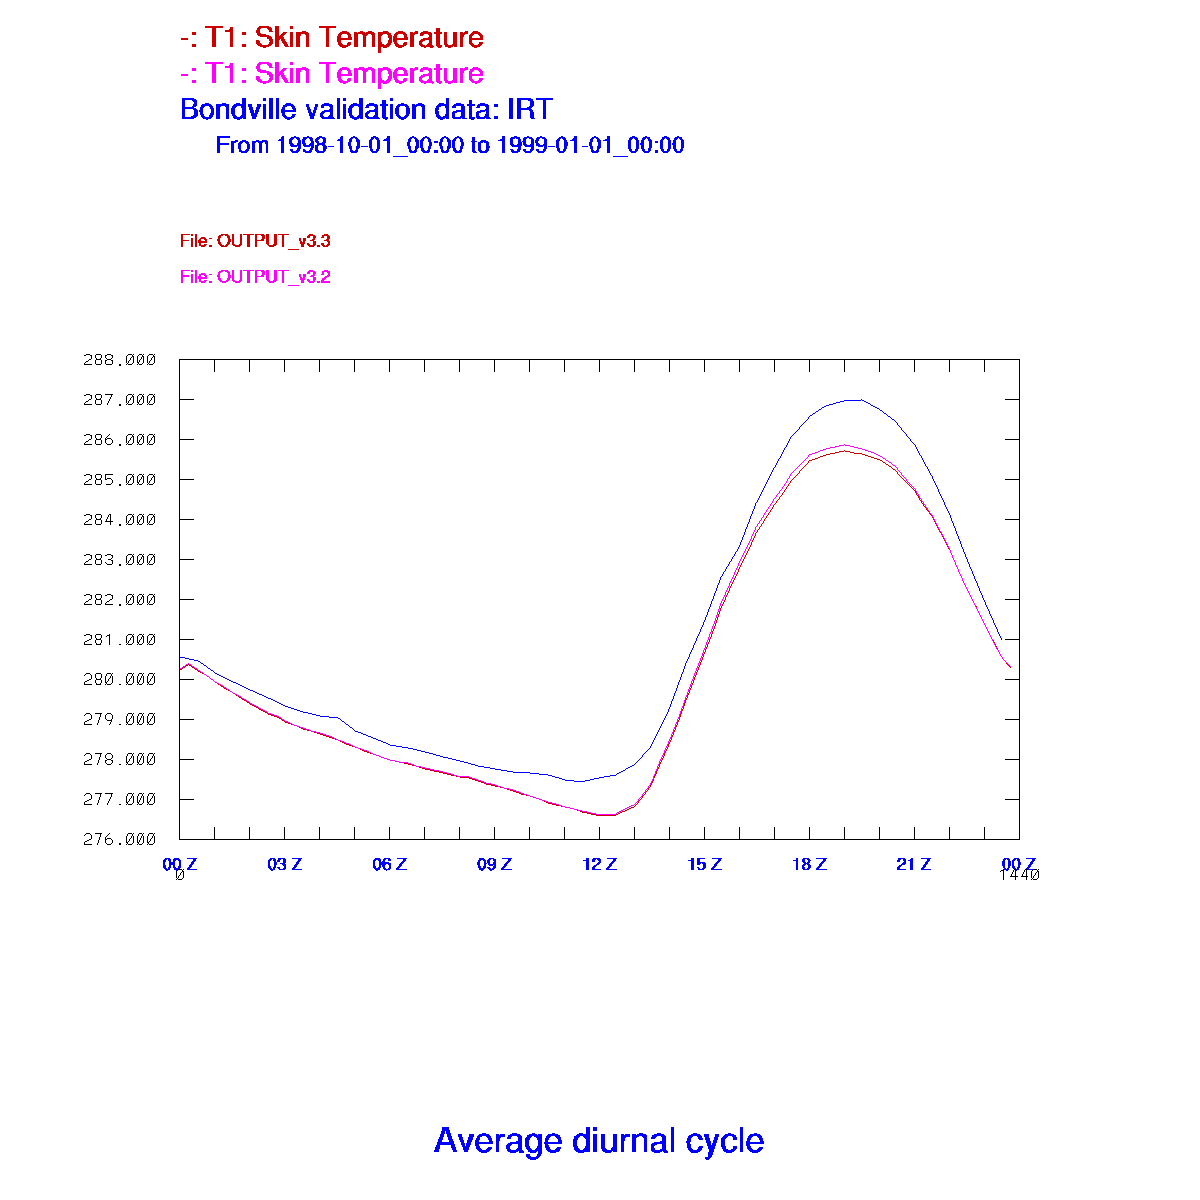
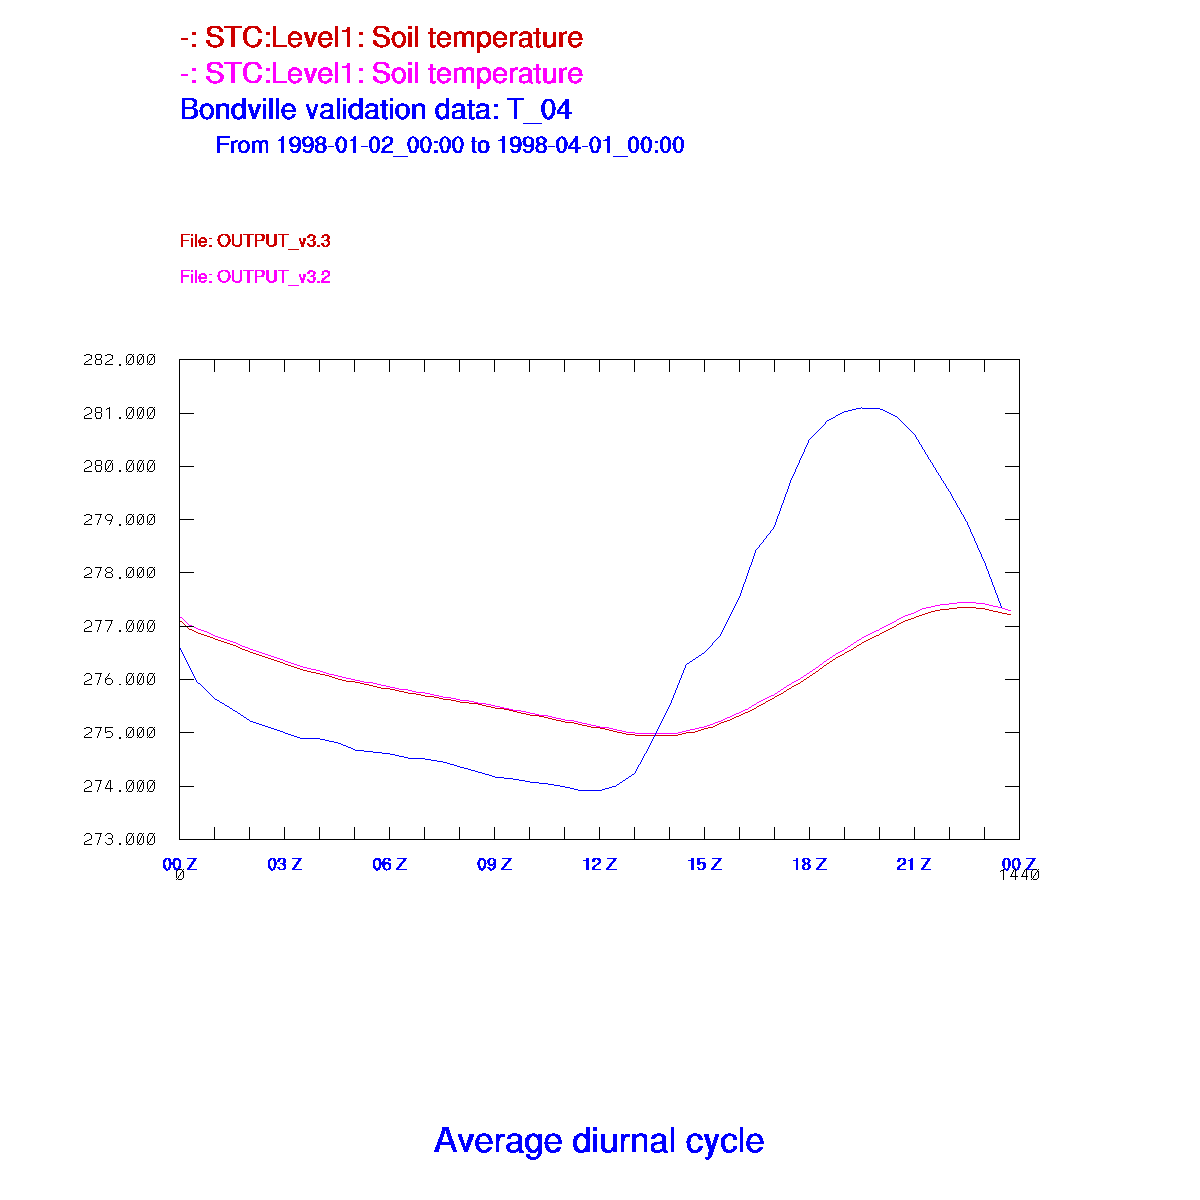
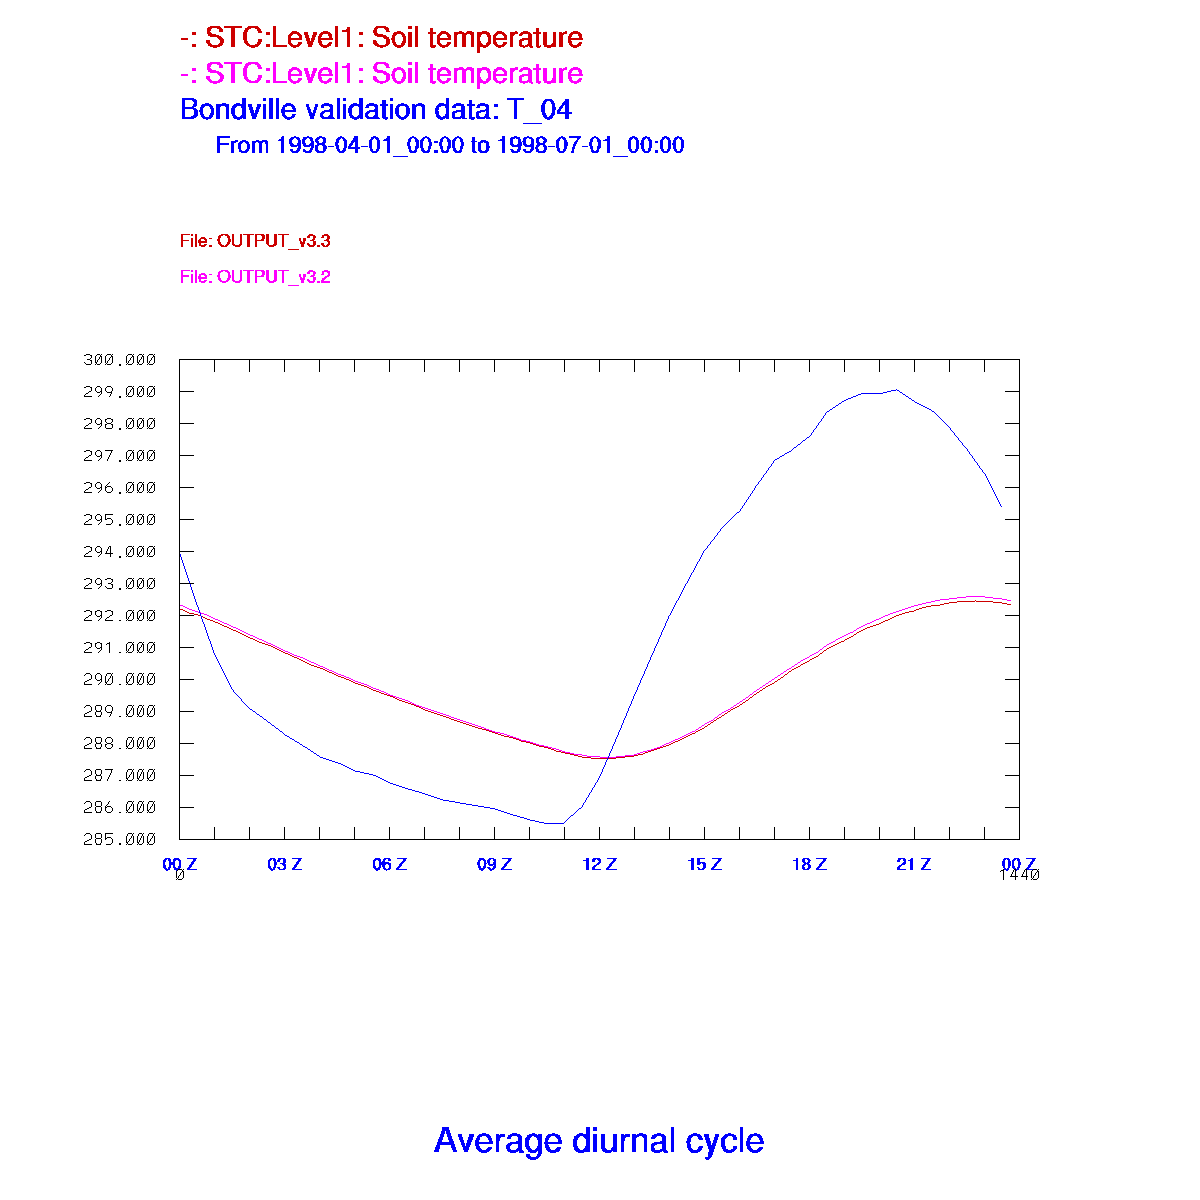
In the table below, observations (when available) are in blue.
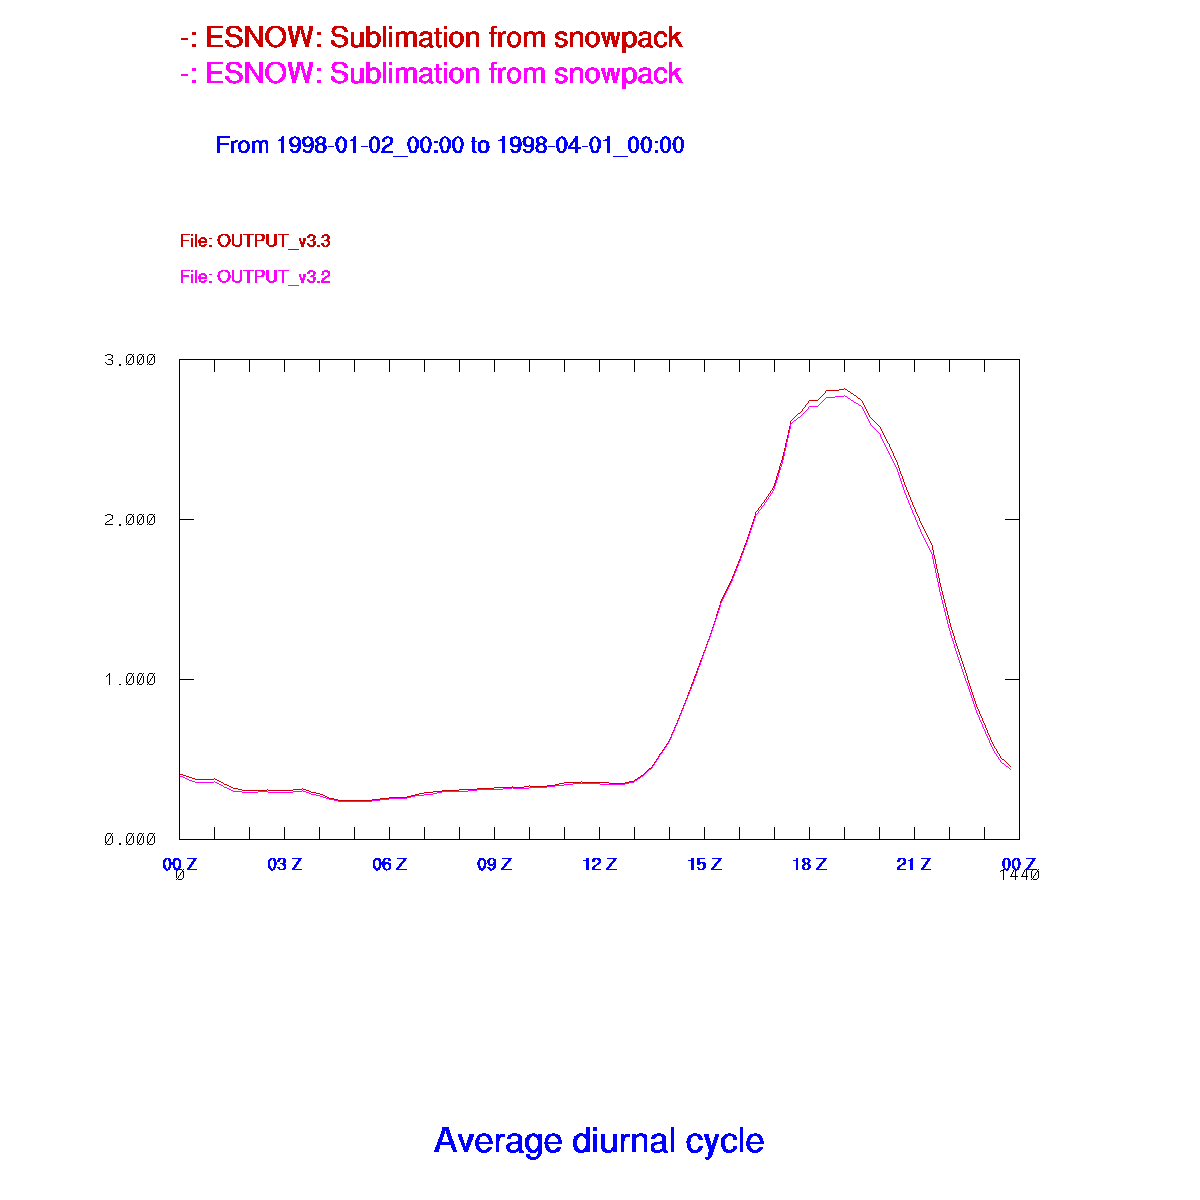
Version 3.2 results are in magenta. Version 3.3 results are in
dark red. Click on the thumbnail images in the table
below for full-sized images.
For the Version 3.2 job, a bug fix has been applied which corrects the
order of IZ0TLND and SFCDIF_OPTION in a subroutine argument list.
|
| Jan-Feb-Mar (Q1) |
Apr-May-Jun (Q2) |
Jul-Aug-Sep (Q3) |
Oct-Nov-Dec (Q4) |
Sensible Heat Flux (HFX)
Average diurnal cycle |
 |
 |
 |
 |
| |
|
|
|
Sensible Heat Flux (HFX)
Scatter Plot |
 |
 |
 |
 |
| |
|
|
|
Latent Heat Flux (QFX)
Average diurnal cycle |
 |
 |
 |
 |
| |
|
|
|
Latent Heat Flux (QFX)
Scatter Plot |
 |
 |
 |
 |
| |
|
|
|
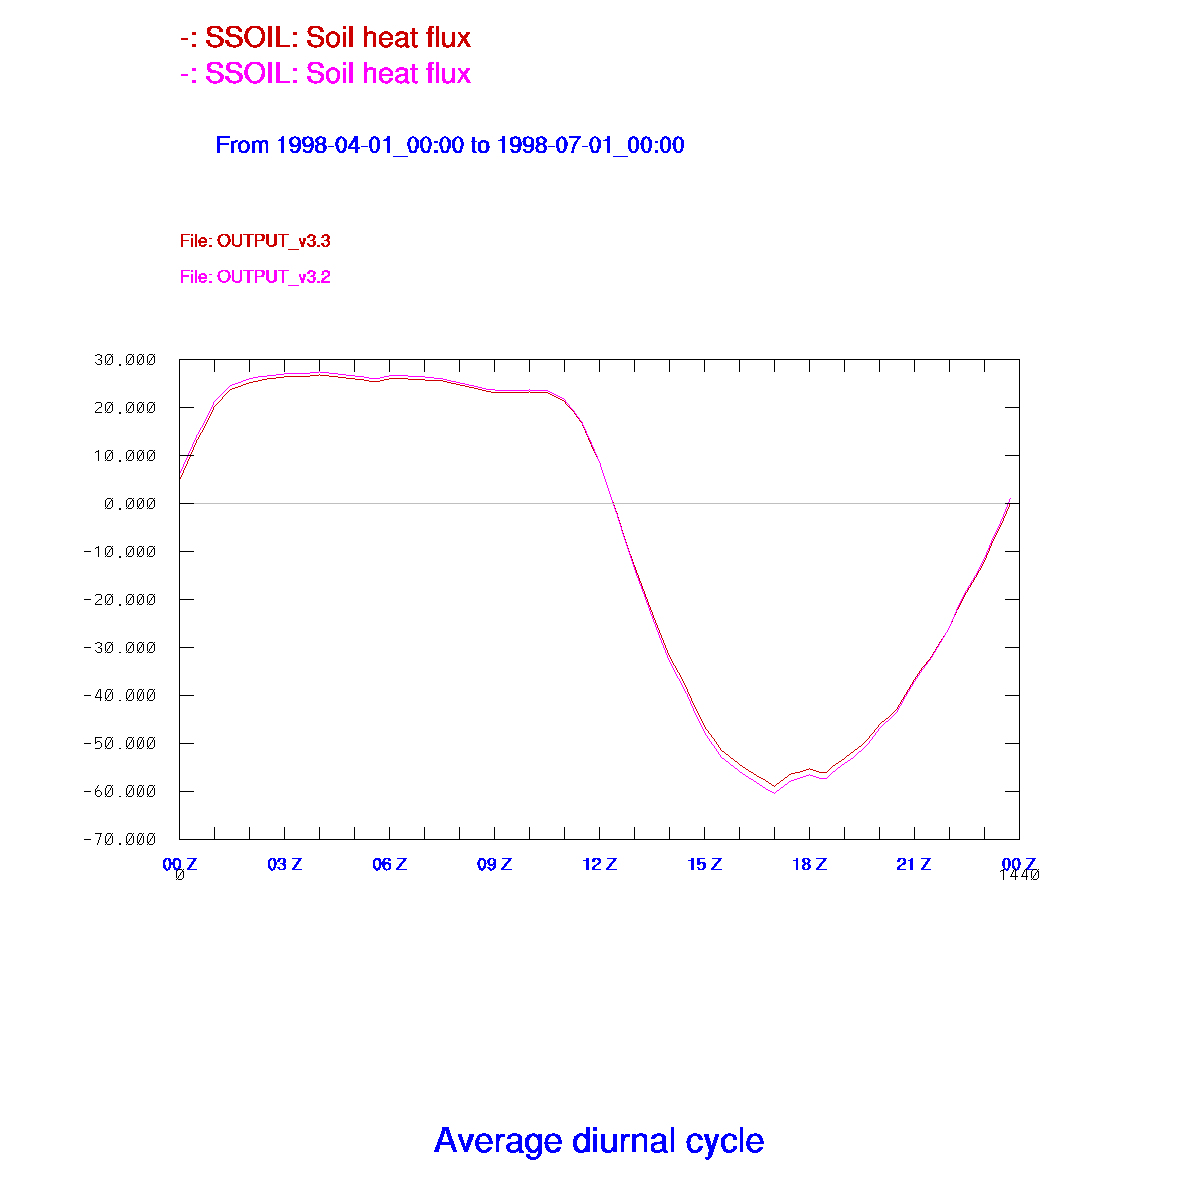
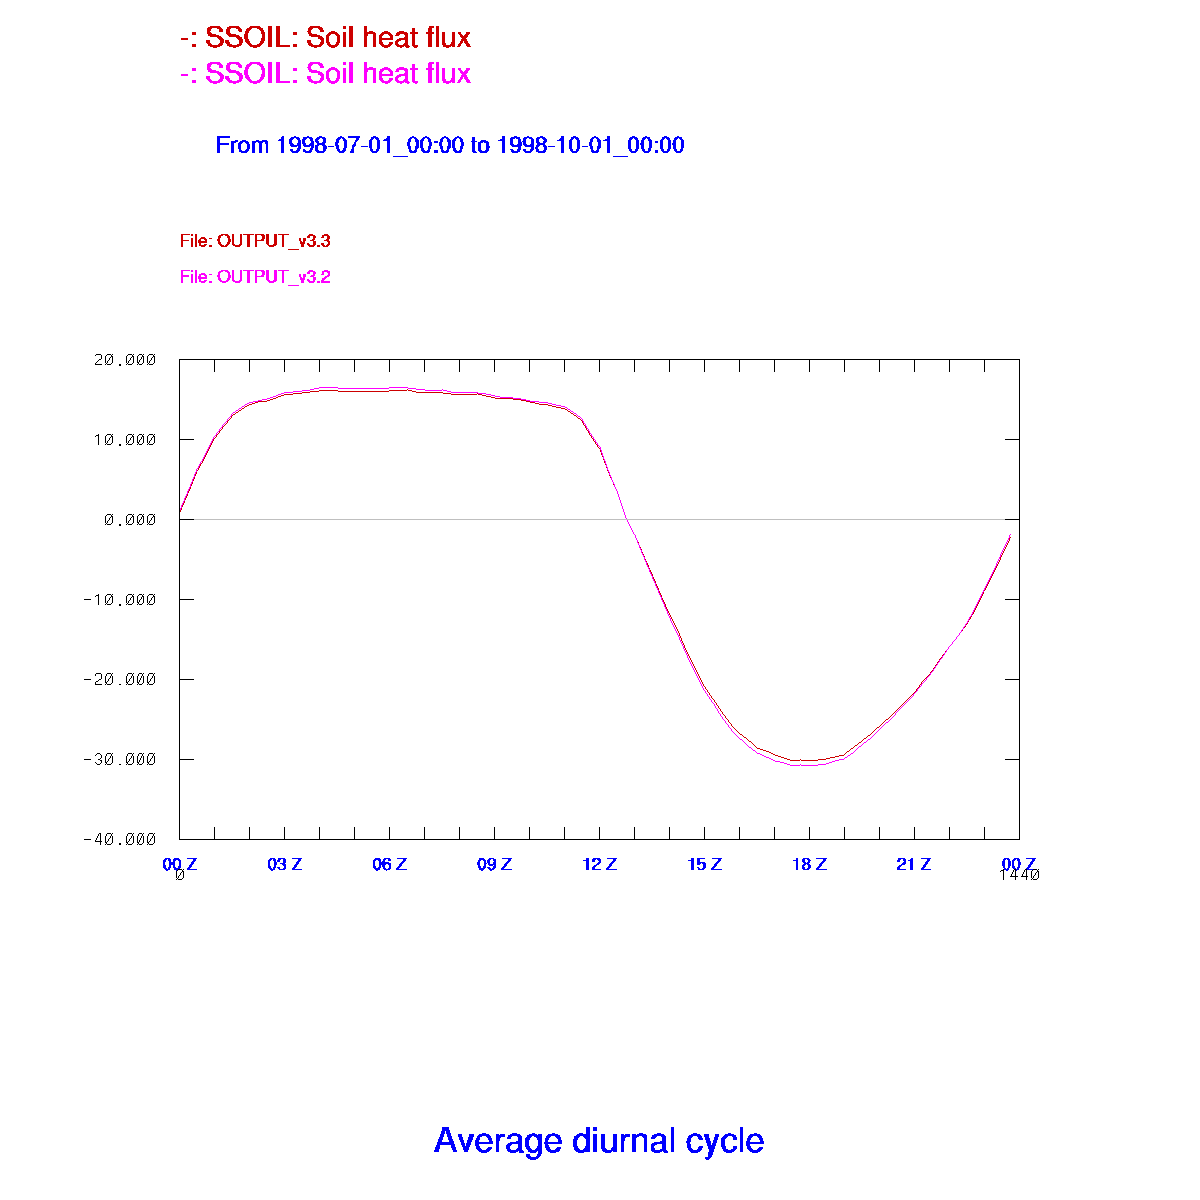
Soil Heat Flux (SSOIL)
Average diurnal cycle |
 |
 |
 |
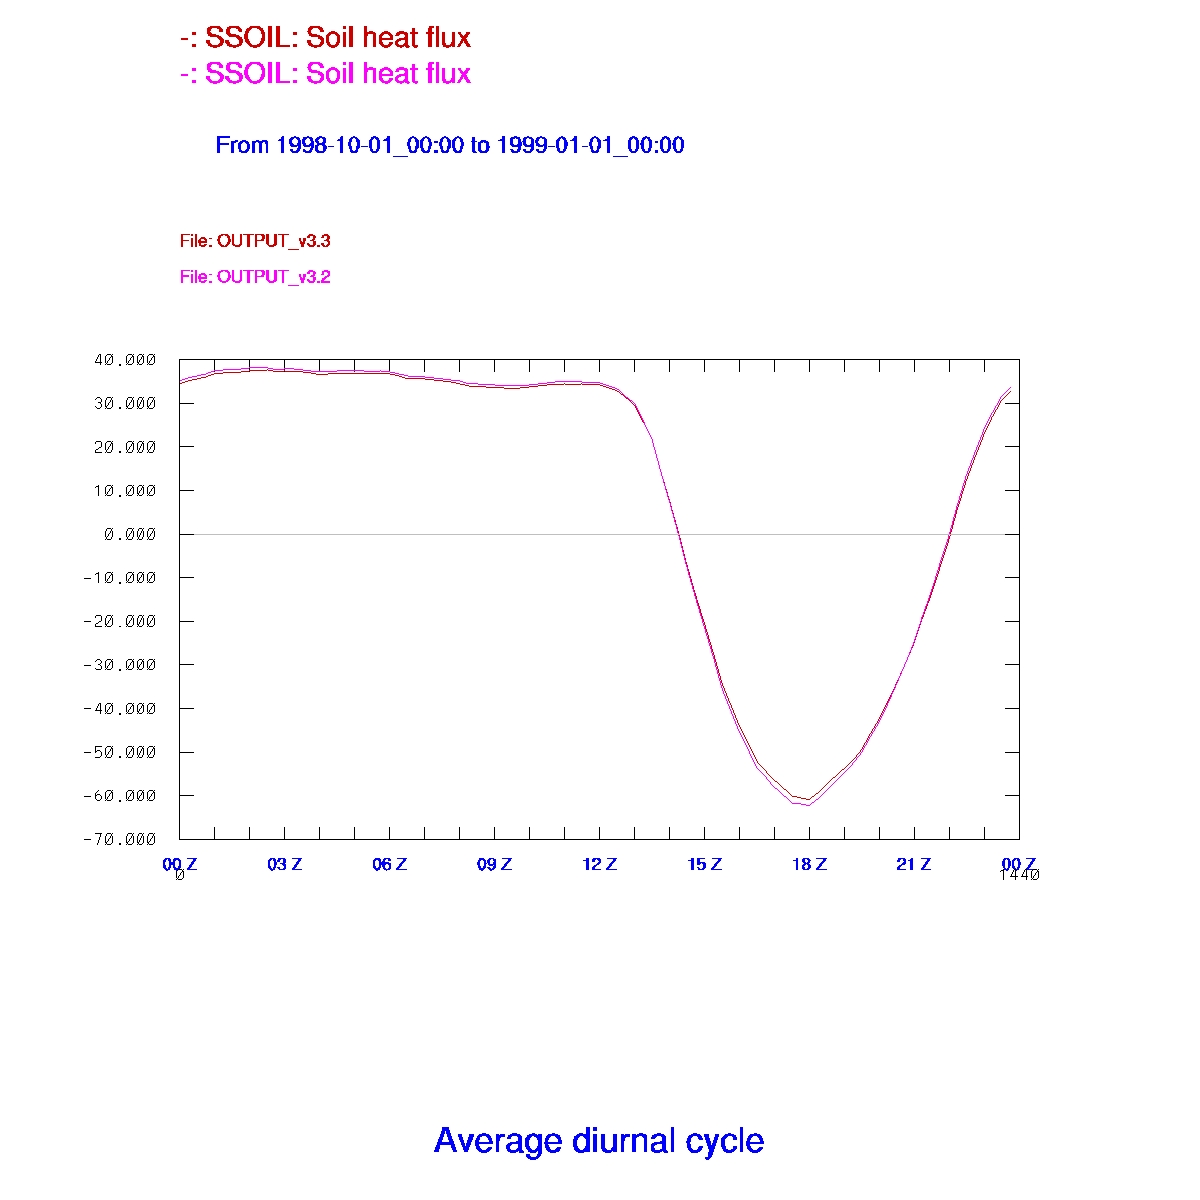 |
| No observations for validation. |
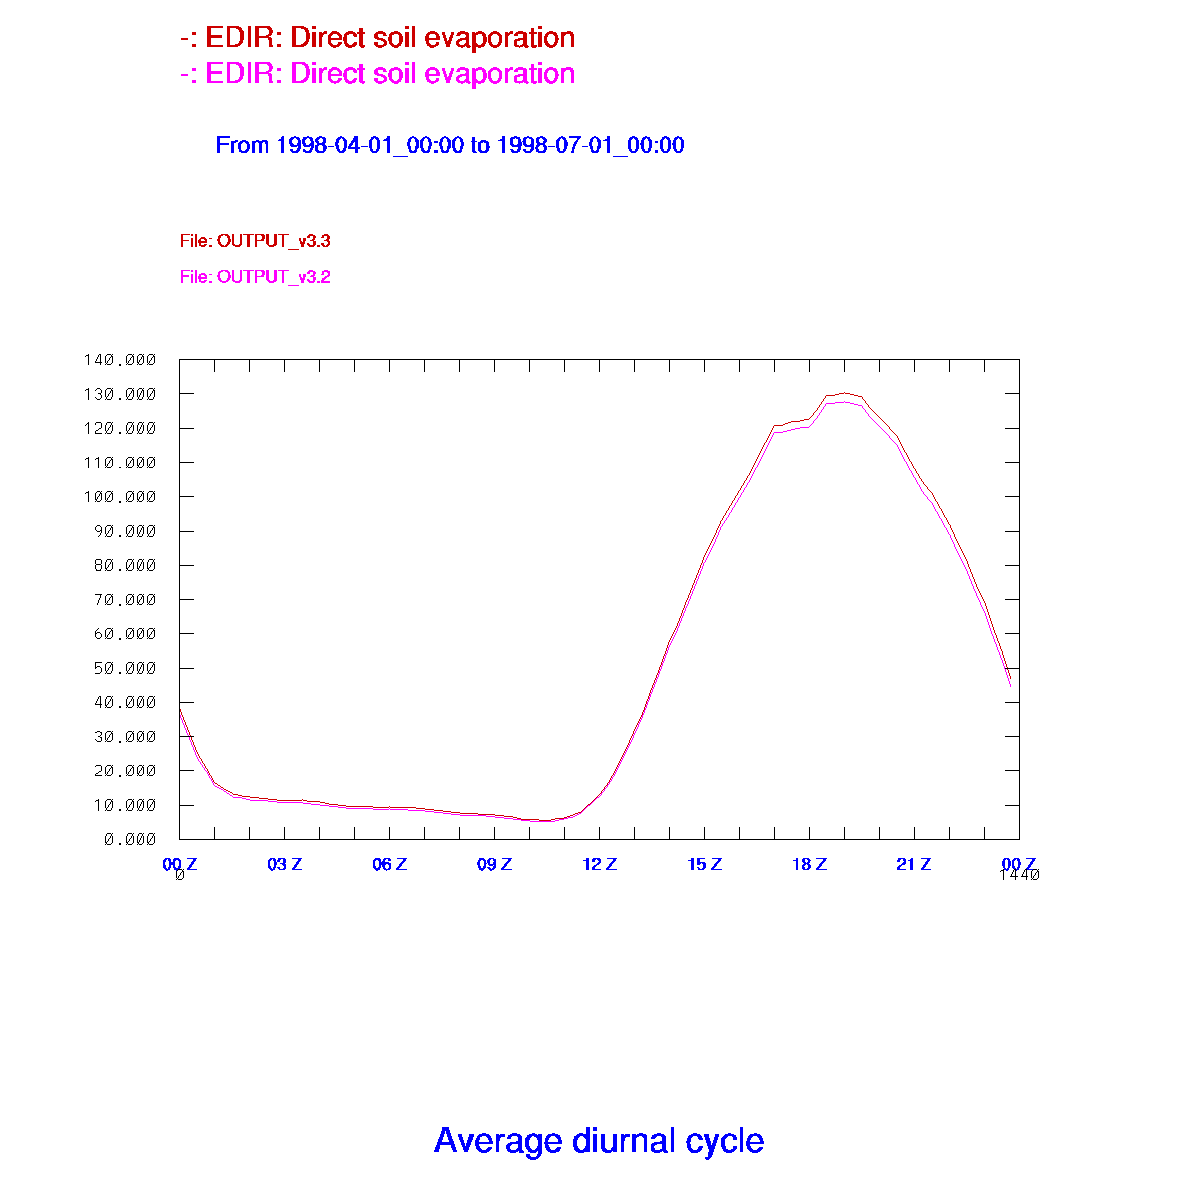
Direct Soil Evaporation (EDIR)
Average diurnal cycle |
 |
 |
 |
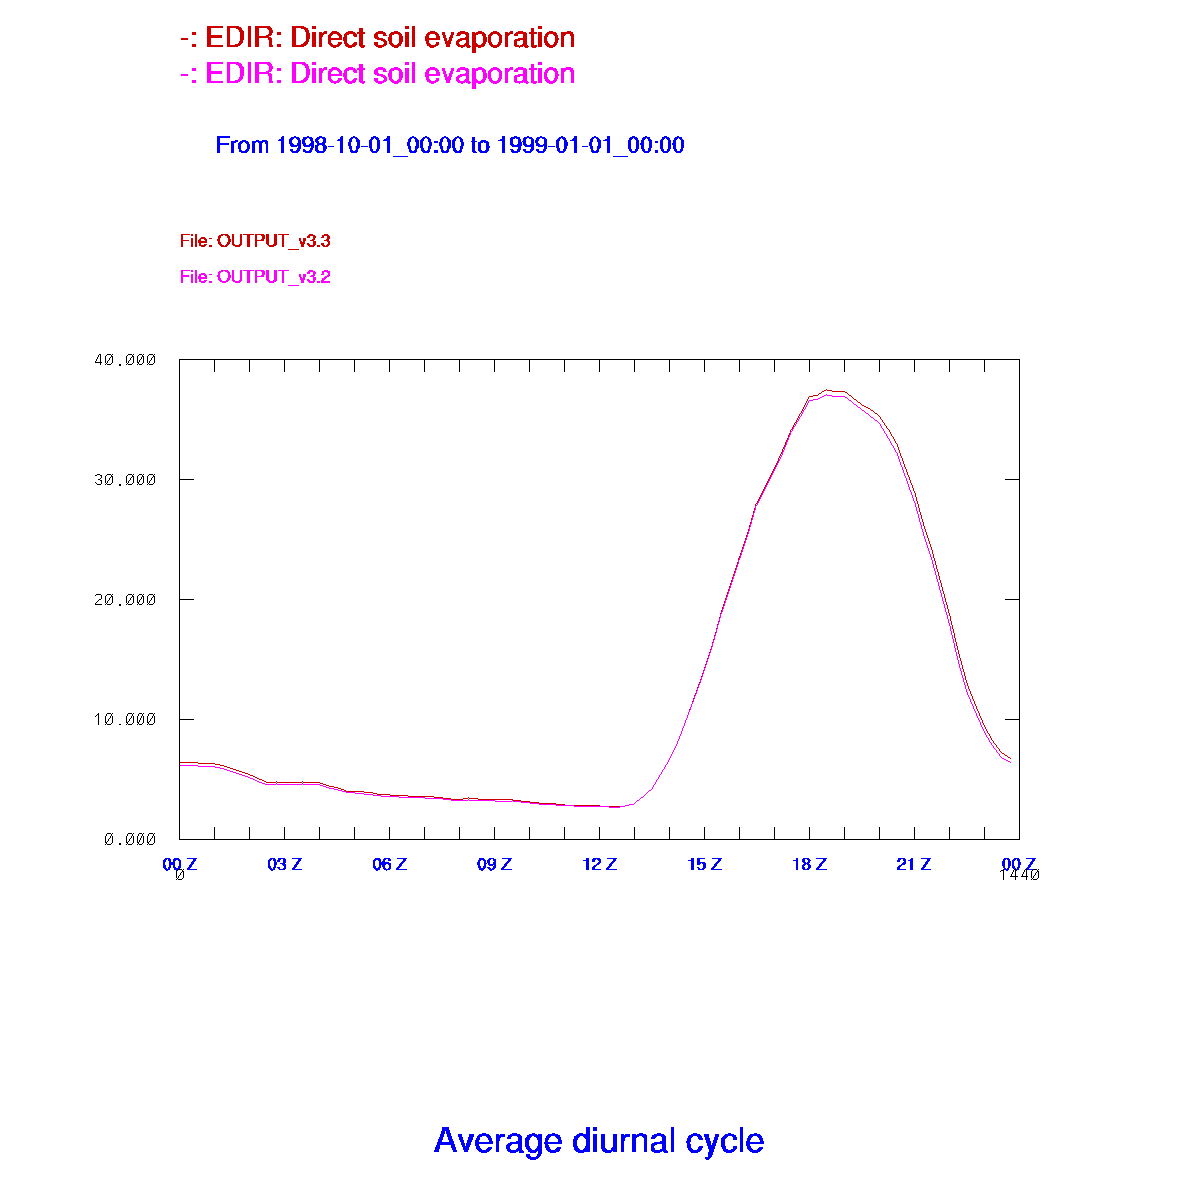 |
| No observations for validation. |
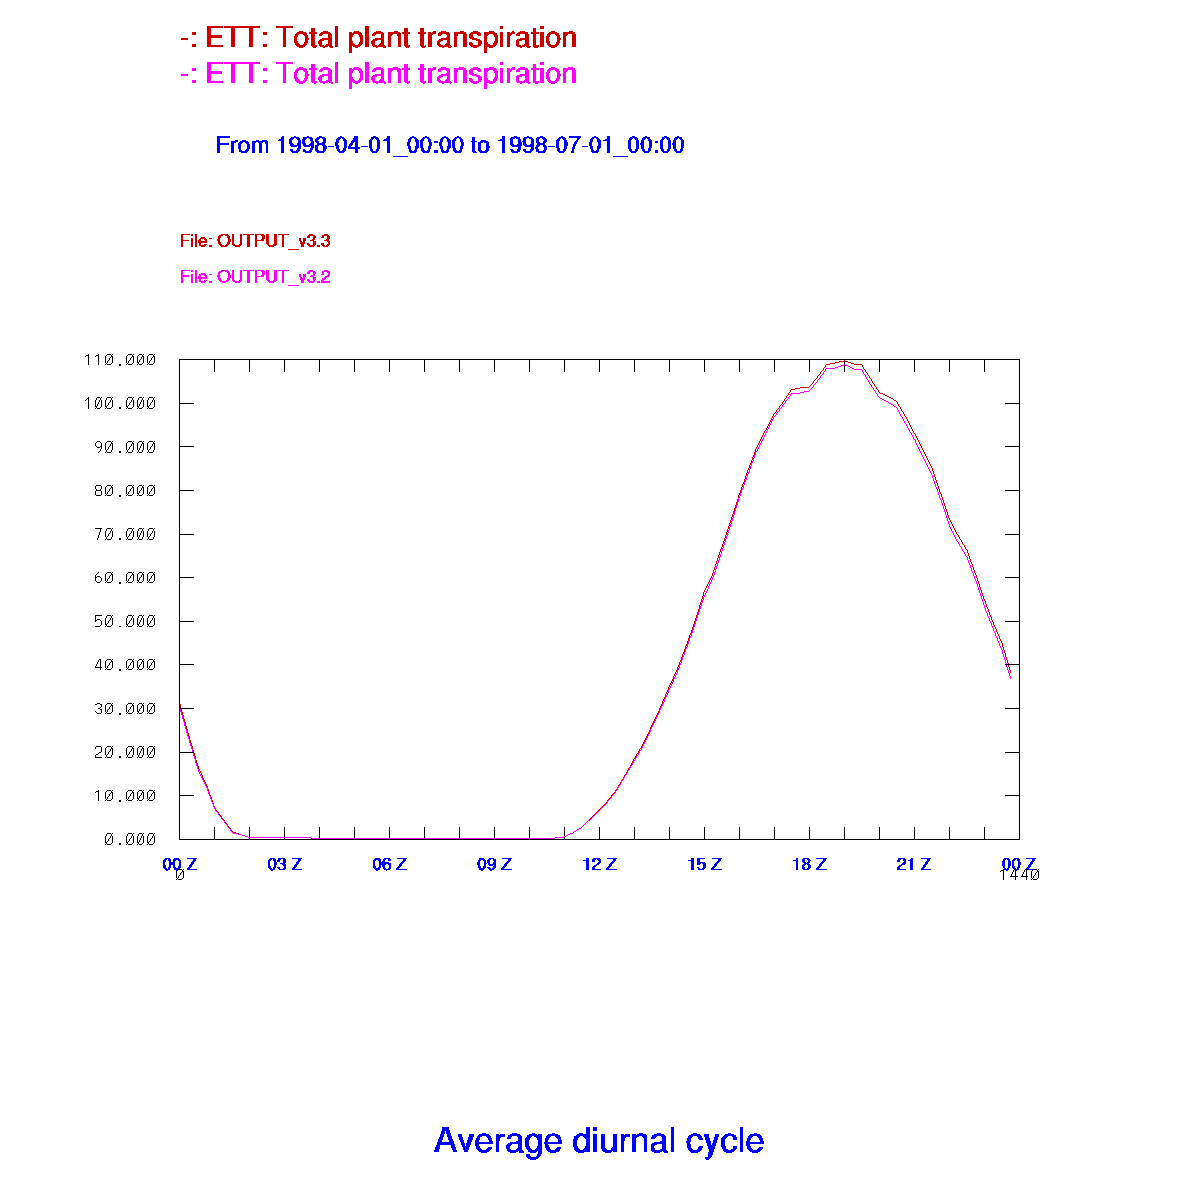
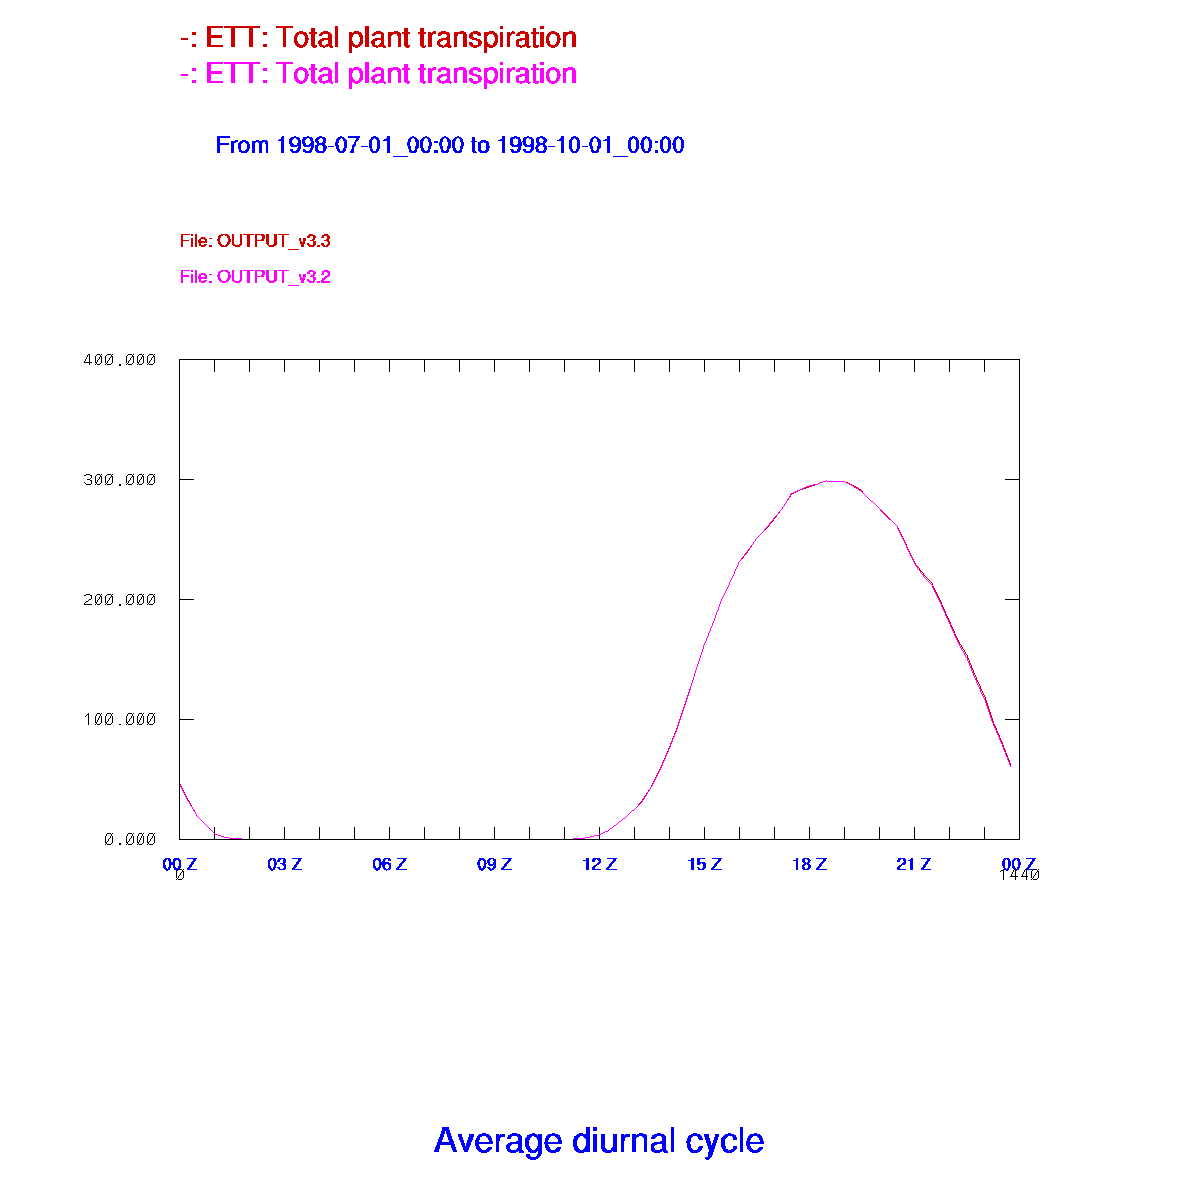
Total Plant Transpiration (ETT)
Average diurnal cycle |
 |
 |
 |
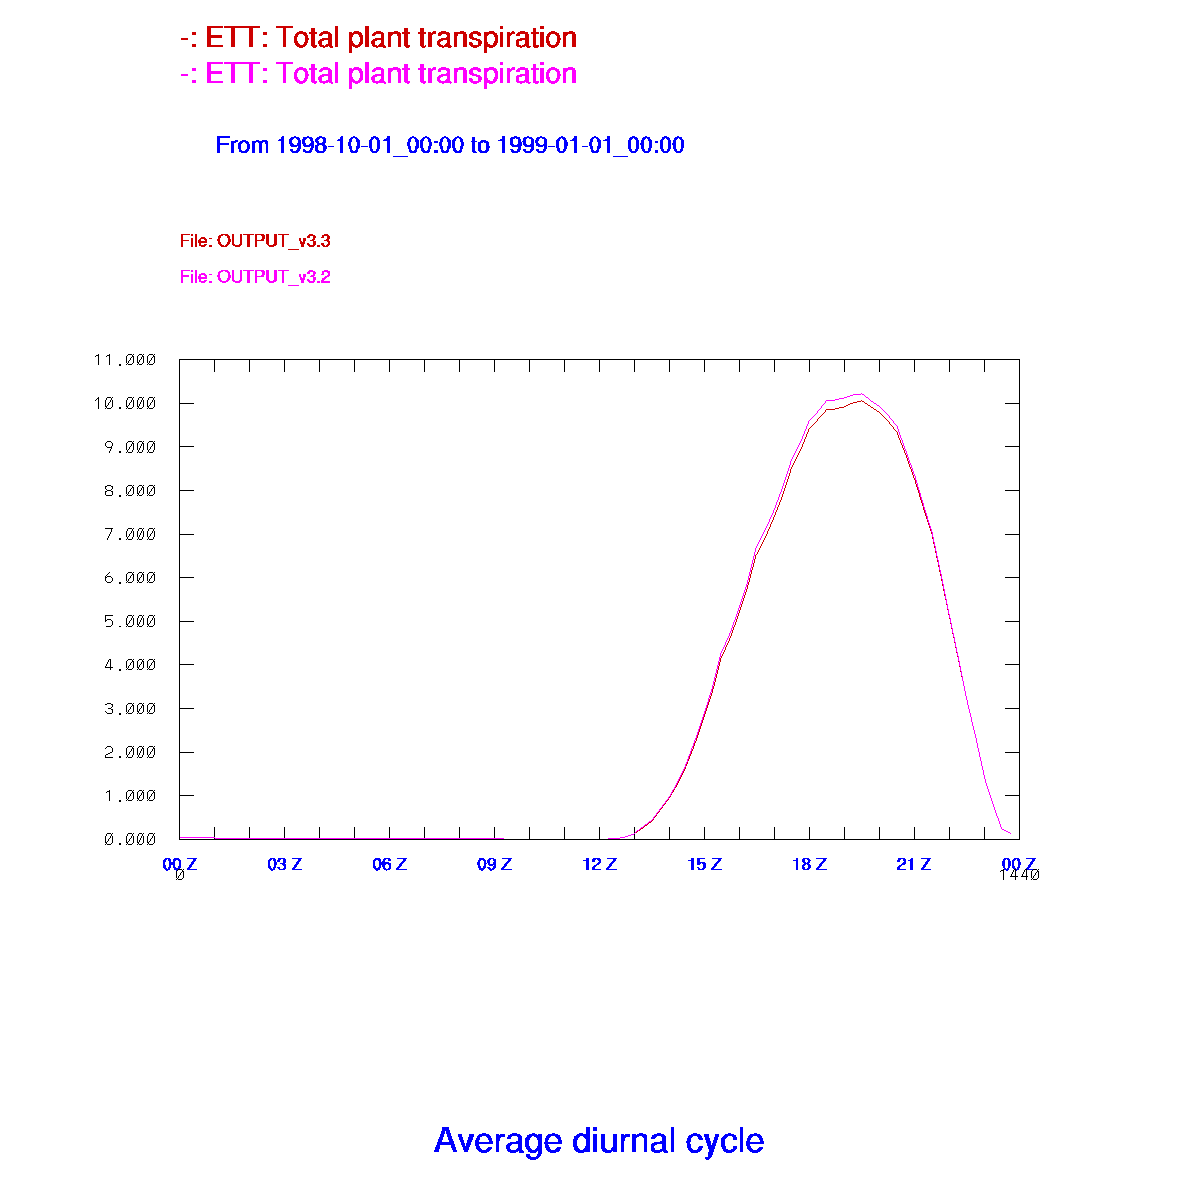 |
| No observations for validation. |
Evaporation from Snow (ESNOW)
Average diurnal cycle |
 |
 |
 |
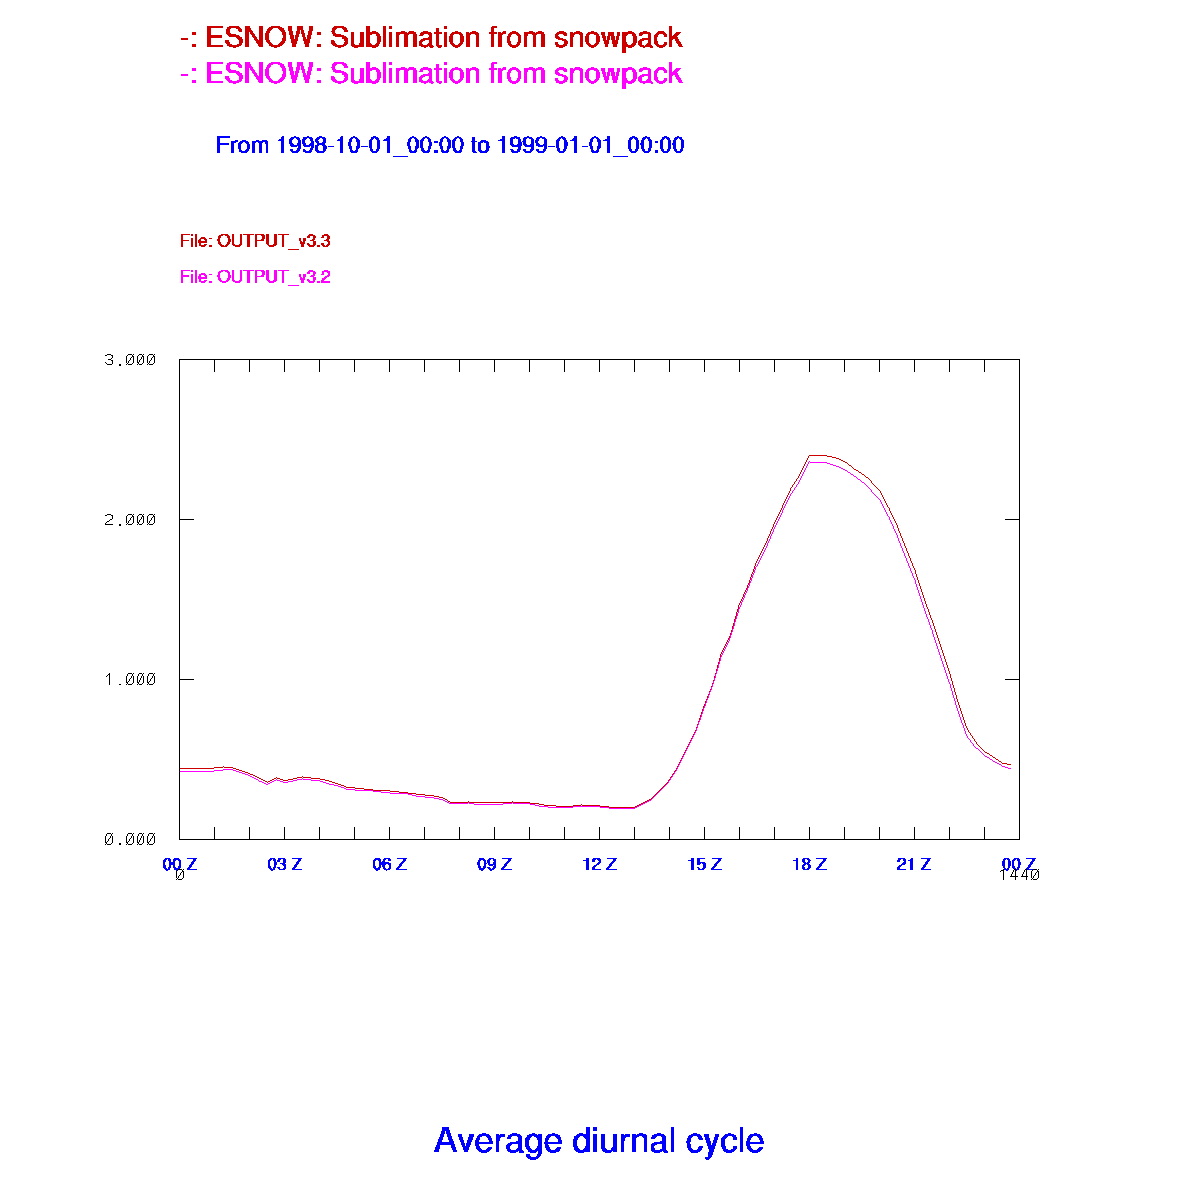 |
| No observations for validation. |
Skin Temperature (T1)
Average diurnal cycle |
 |
 |
 |
 |
| |
|
|
|
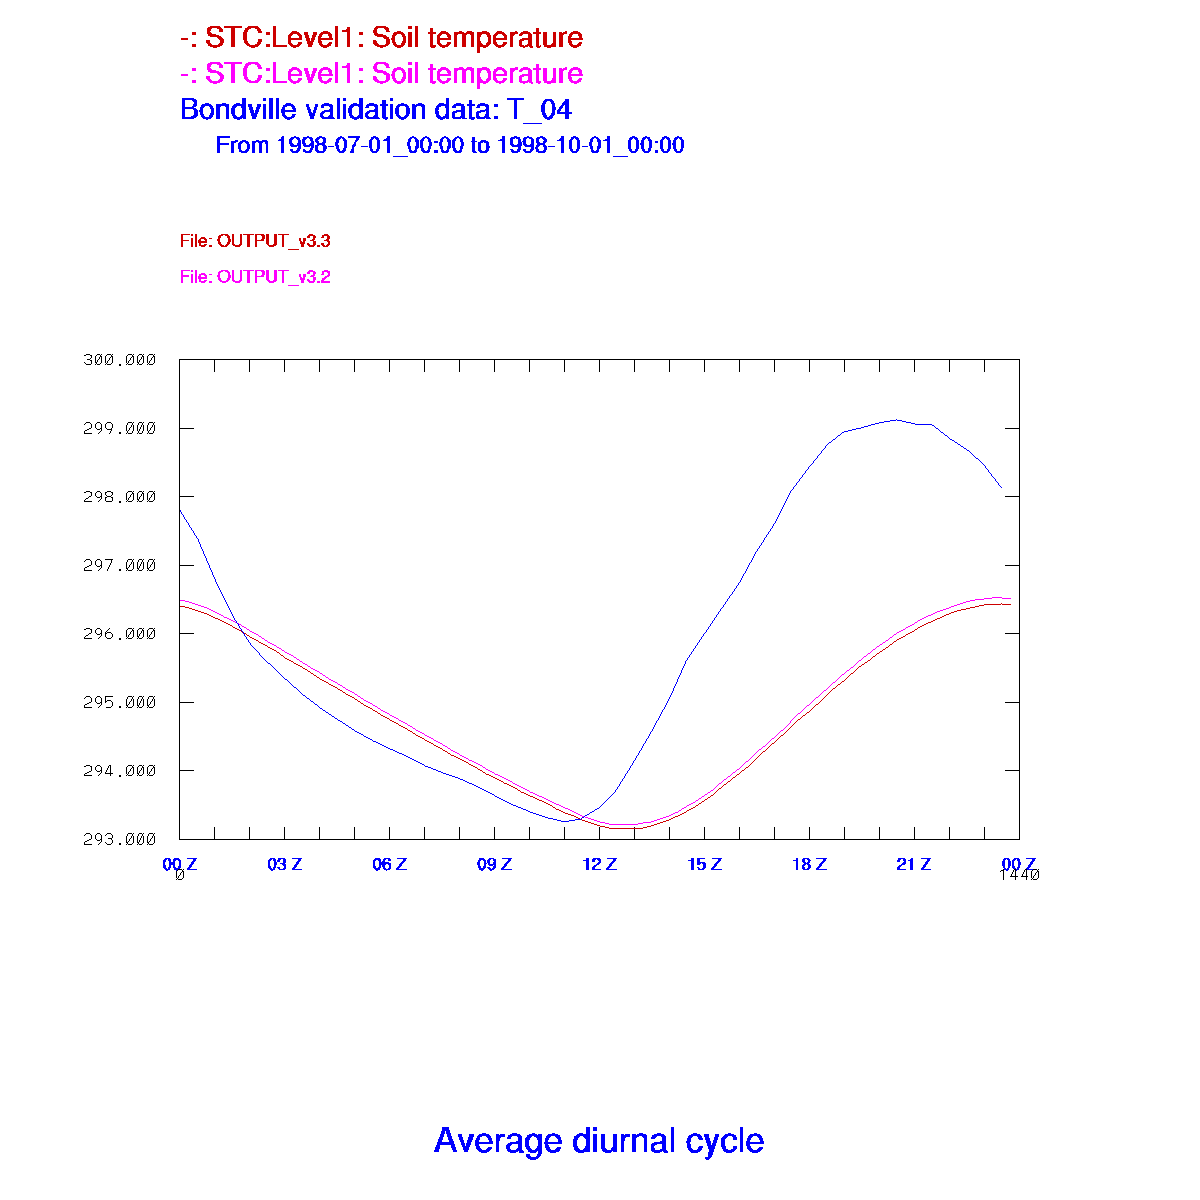
Soil Temperature, Layer 1 (ST1)
Average diurnal cycle |
 |
 |
 |
 |
|
We are comparing the temperature observation at 4 cm below the surface, to the Noah layer temperature from surface to 10 cm.
|
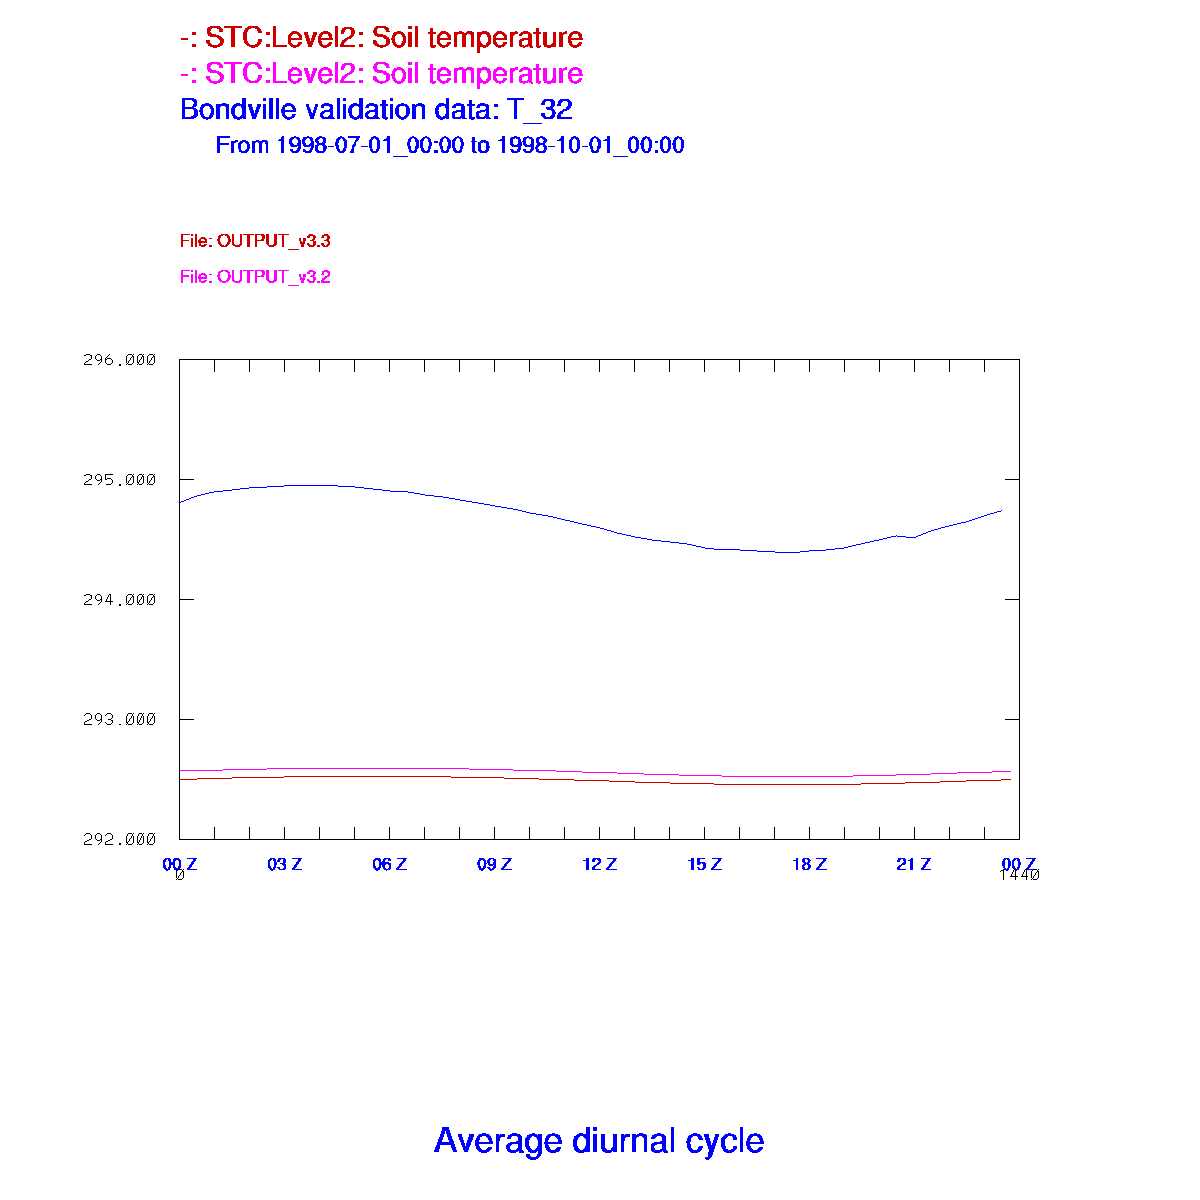
Soil Temperature, Layer 2 (ST2)
Average diurnal cycle |
 |
 |
 |
 |
|
We are plotting the observations at 32 cm below the surface, and the Noah layer from 10 to 40 cm below ground (i.e., centered at 25 cm below ground).
|
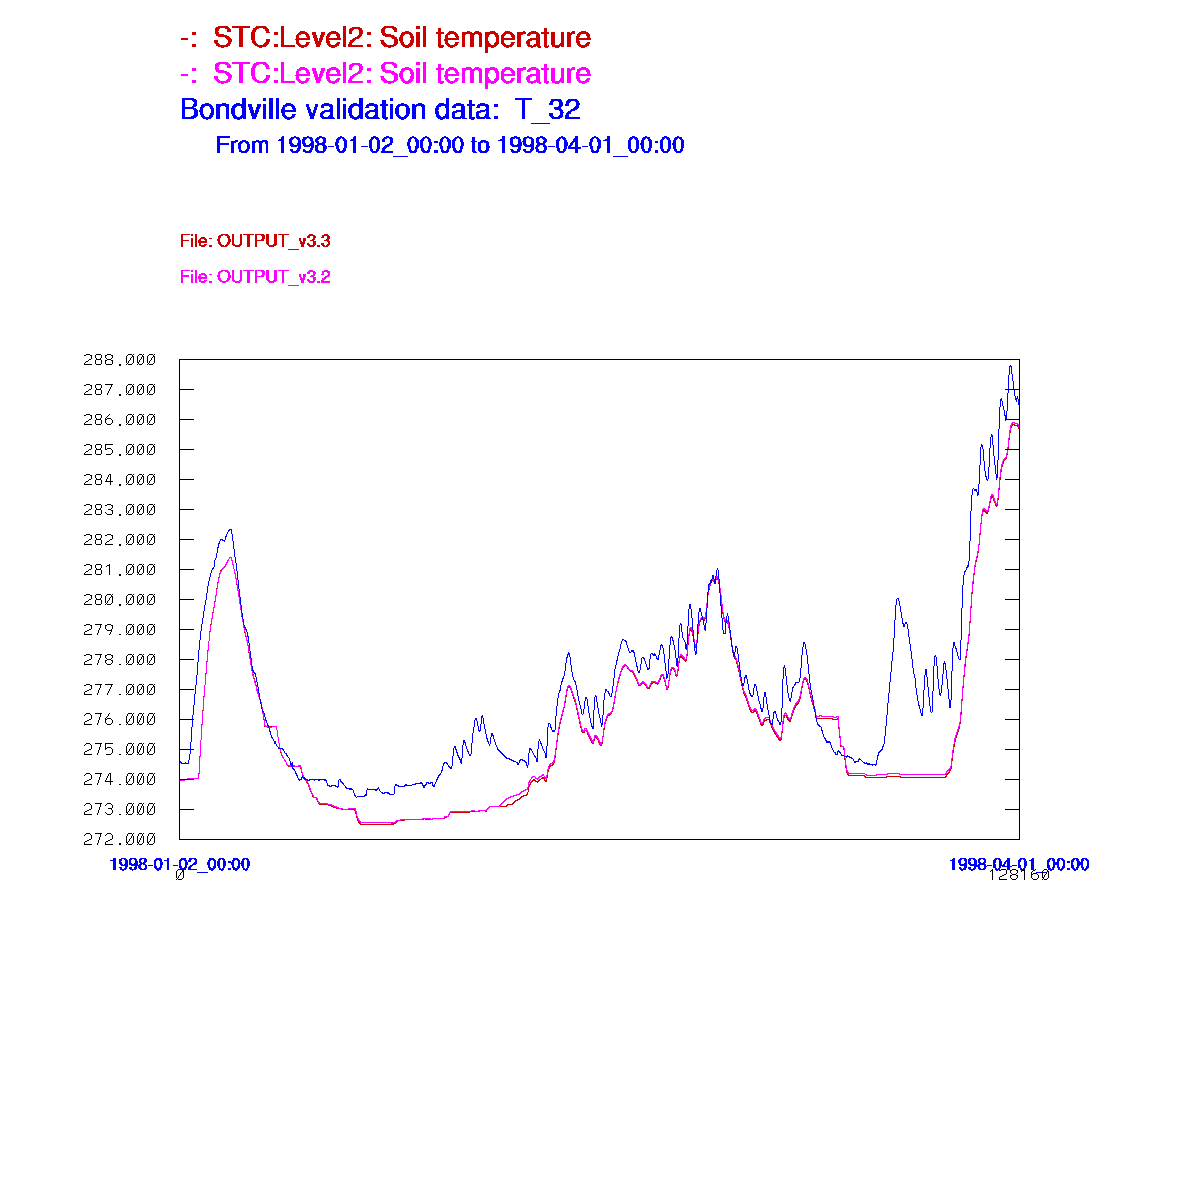
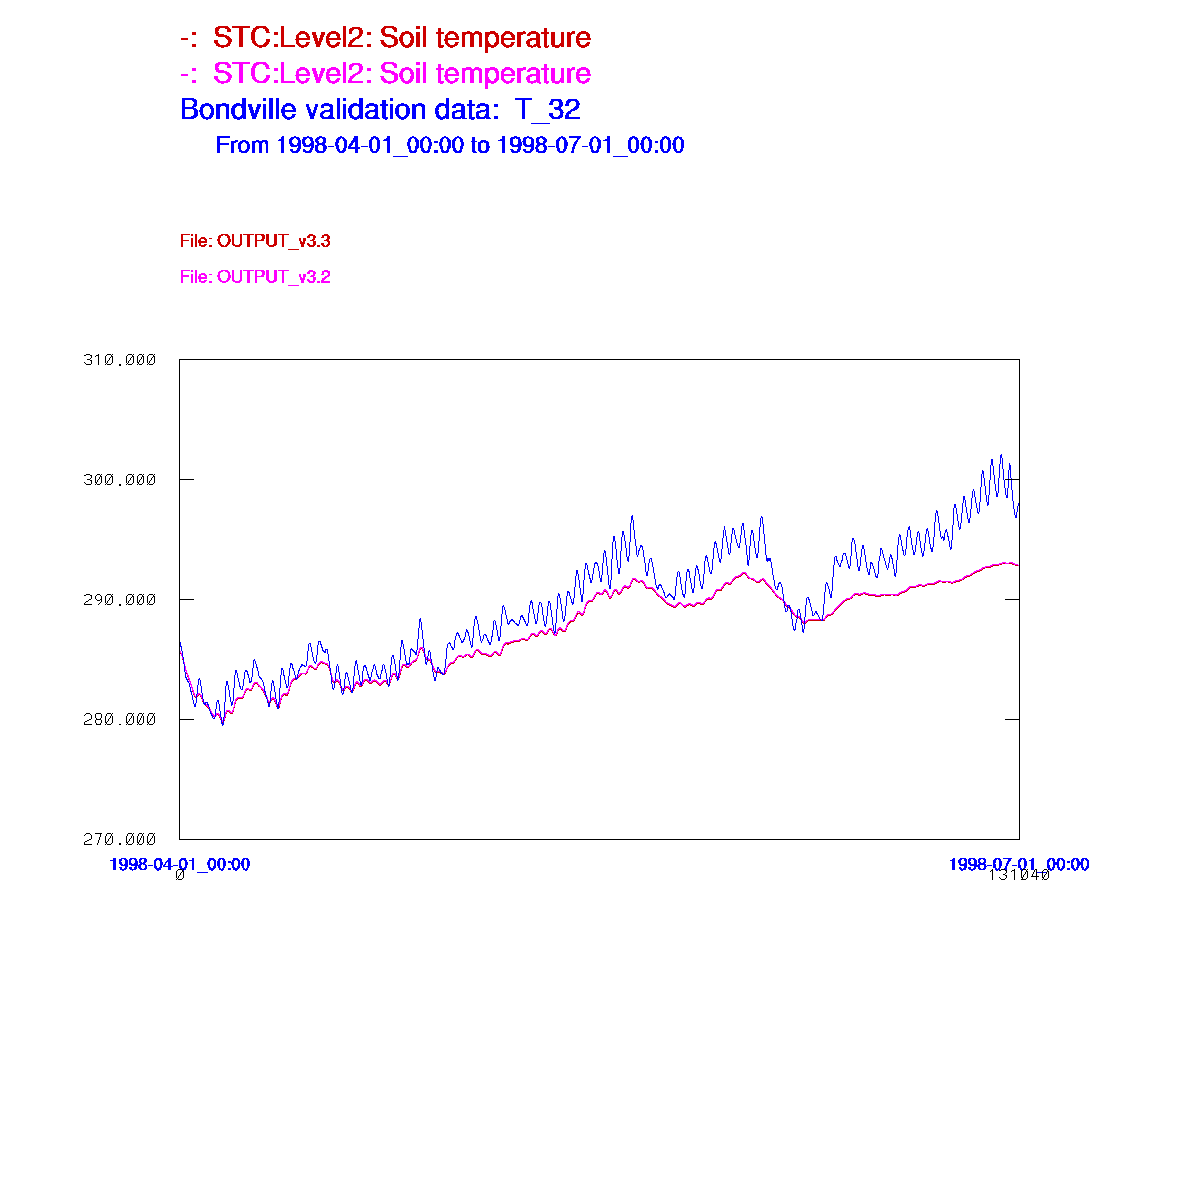
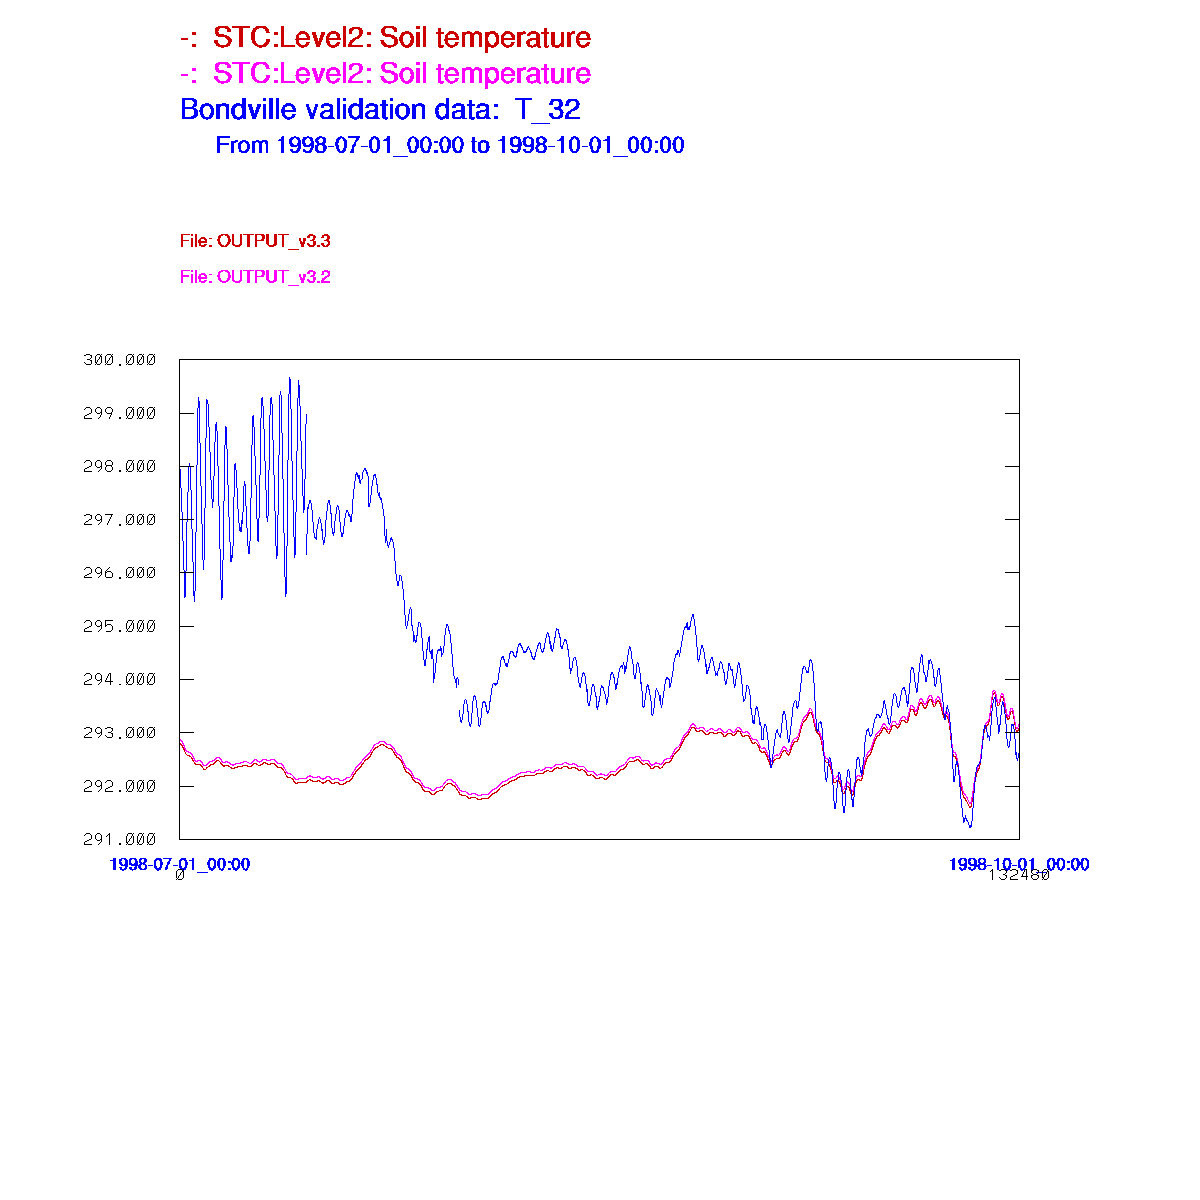
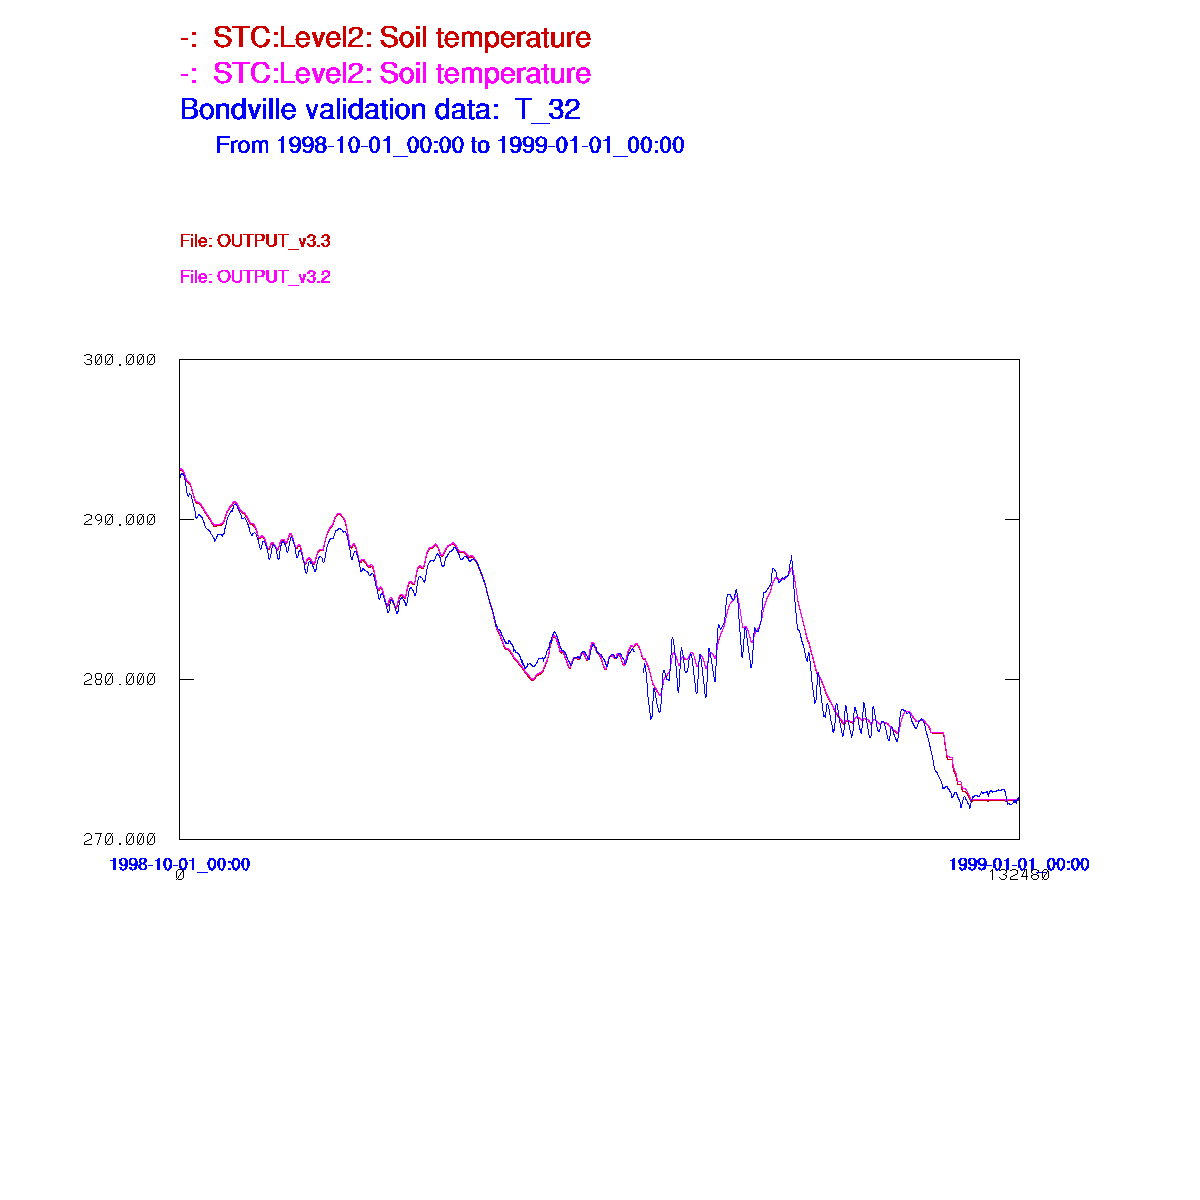
Soil Temperature, Layer 2 (ST2)
Unaveraged time series |
 |
 |
 |
 |
|
Plotting the observations at 32 cm below the surface, and the Noah layer from 10 to 40 cm below ground (i.e., centered at 25 cm below ground).
|
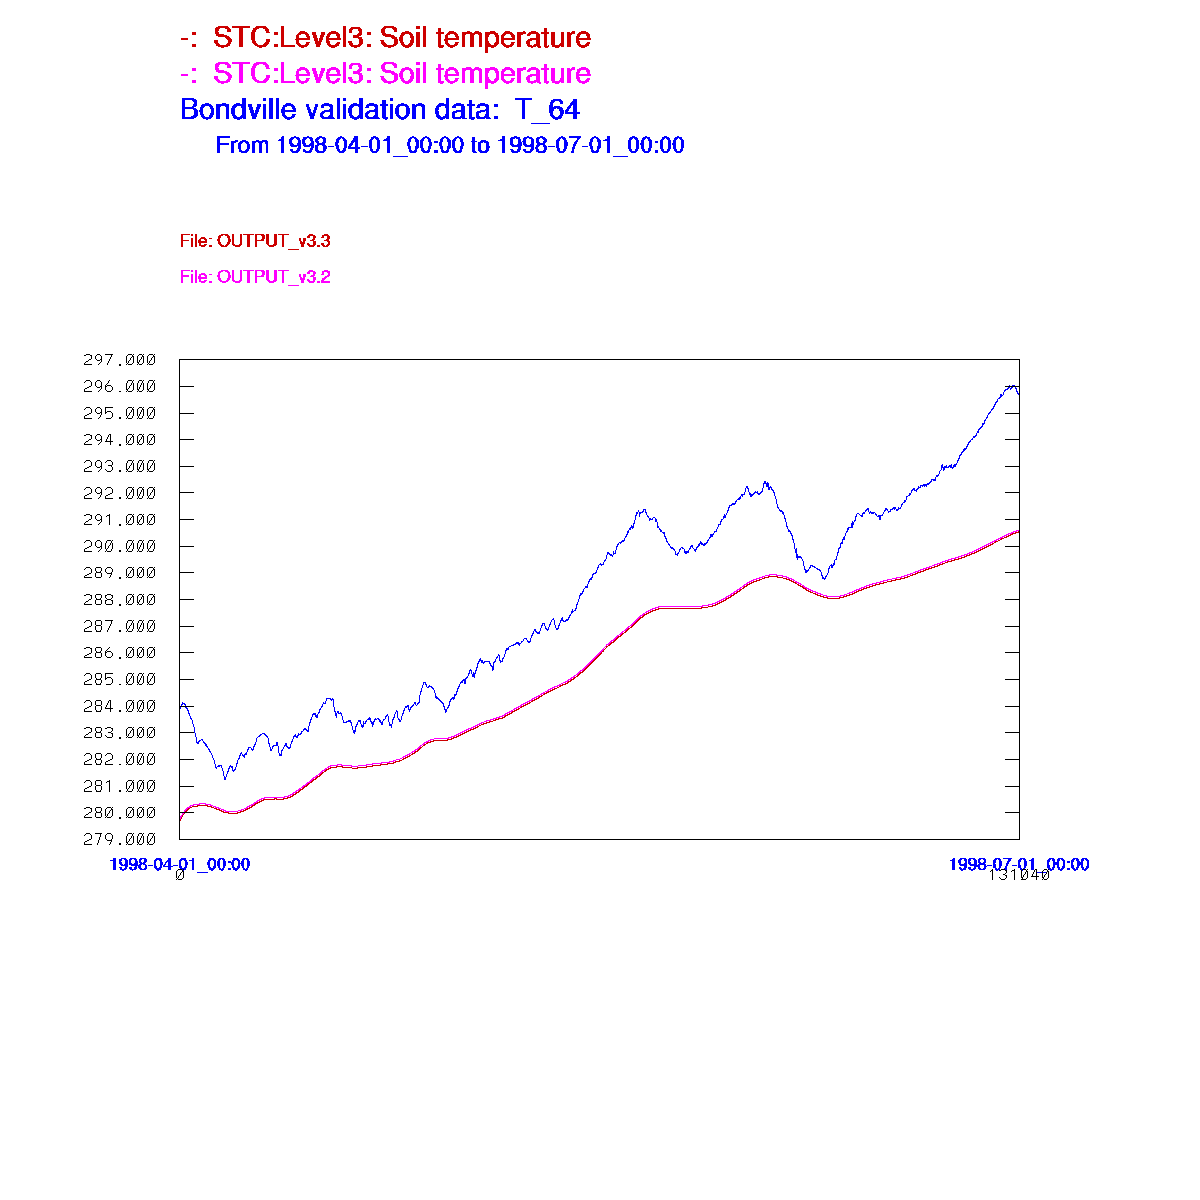
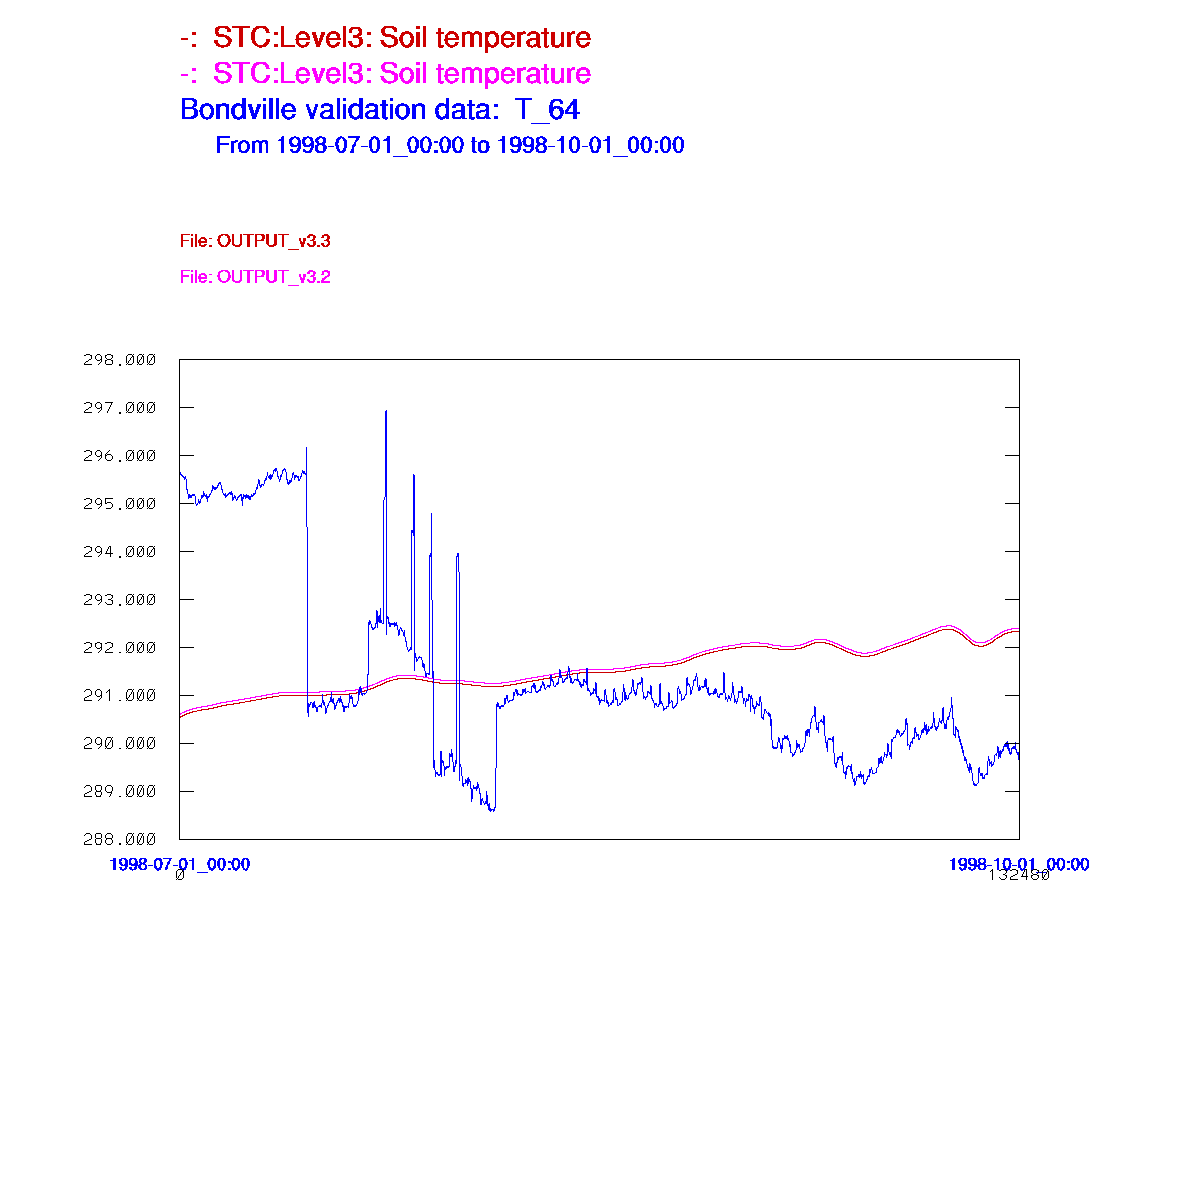
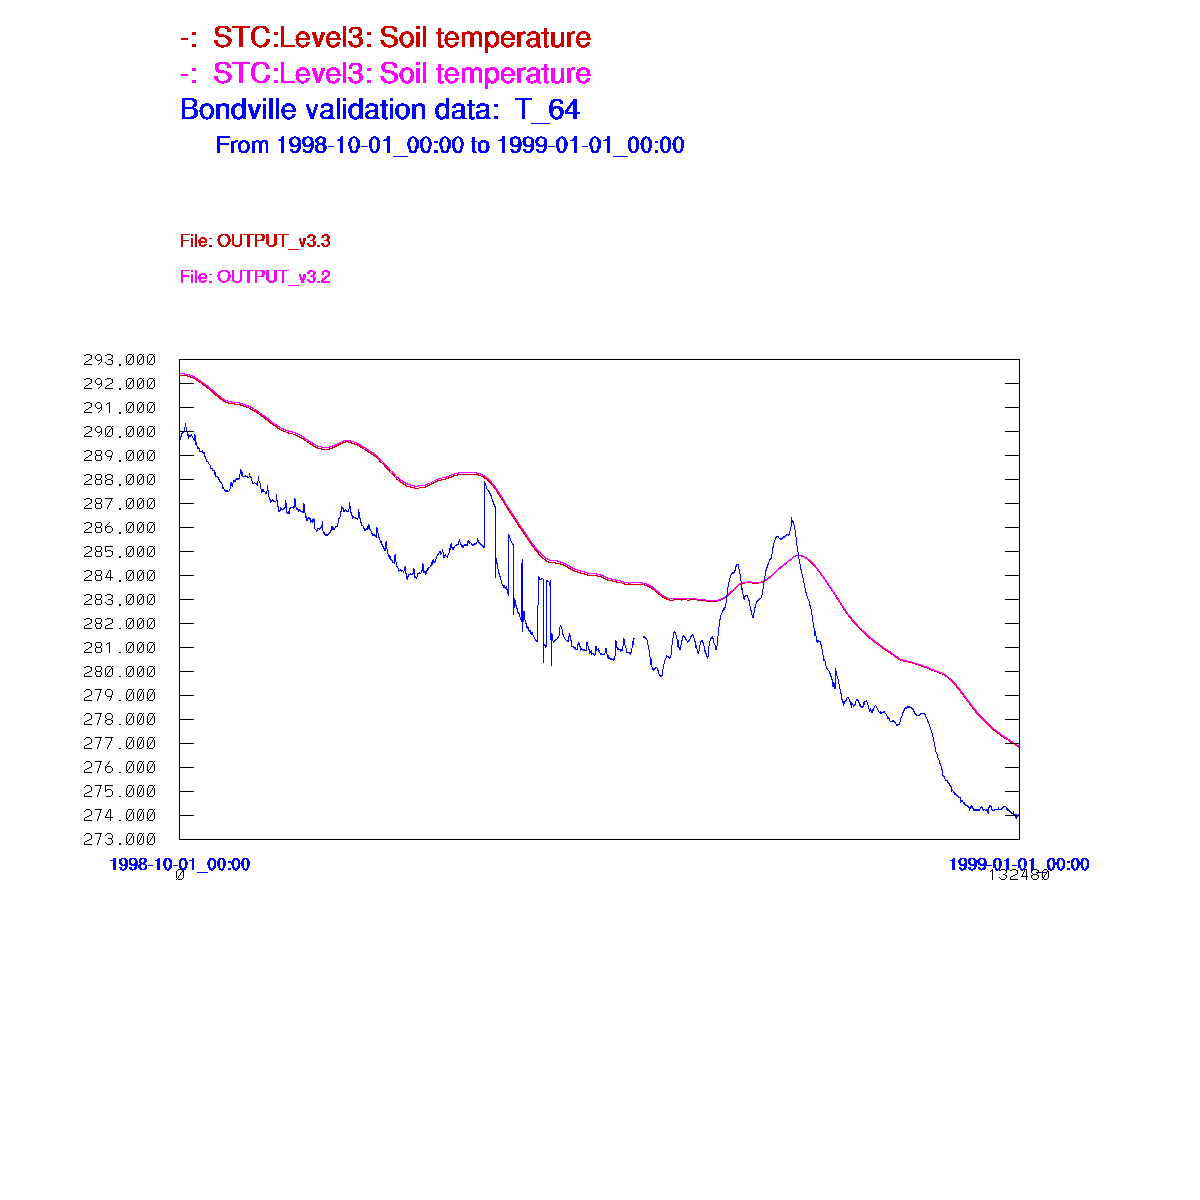
Soil Temperature, Layer 3 (ST3)
Unaveraged time series |
 |
 |
 |
 |
|
Comparing observations at 64 cm below ground to the Noah layer 40 to 100 cm below ground (i.e., centered at 70 cm below ground).
|
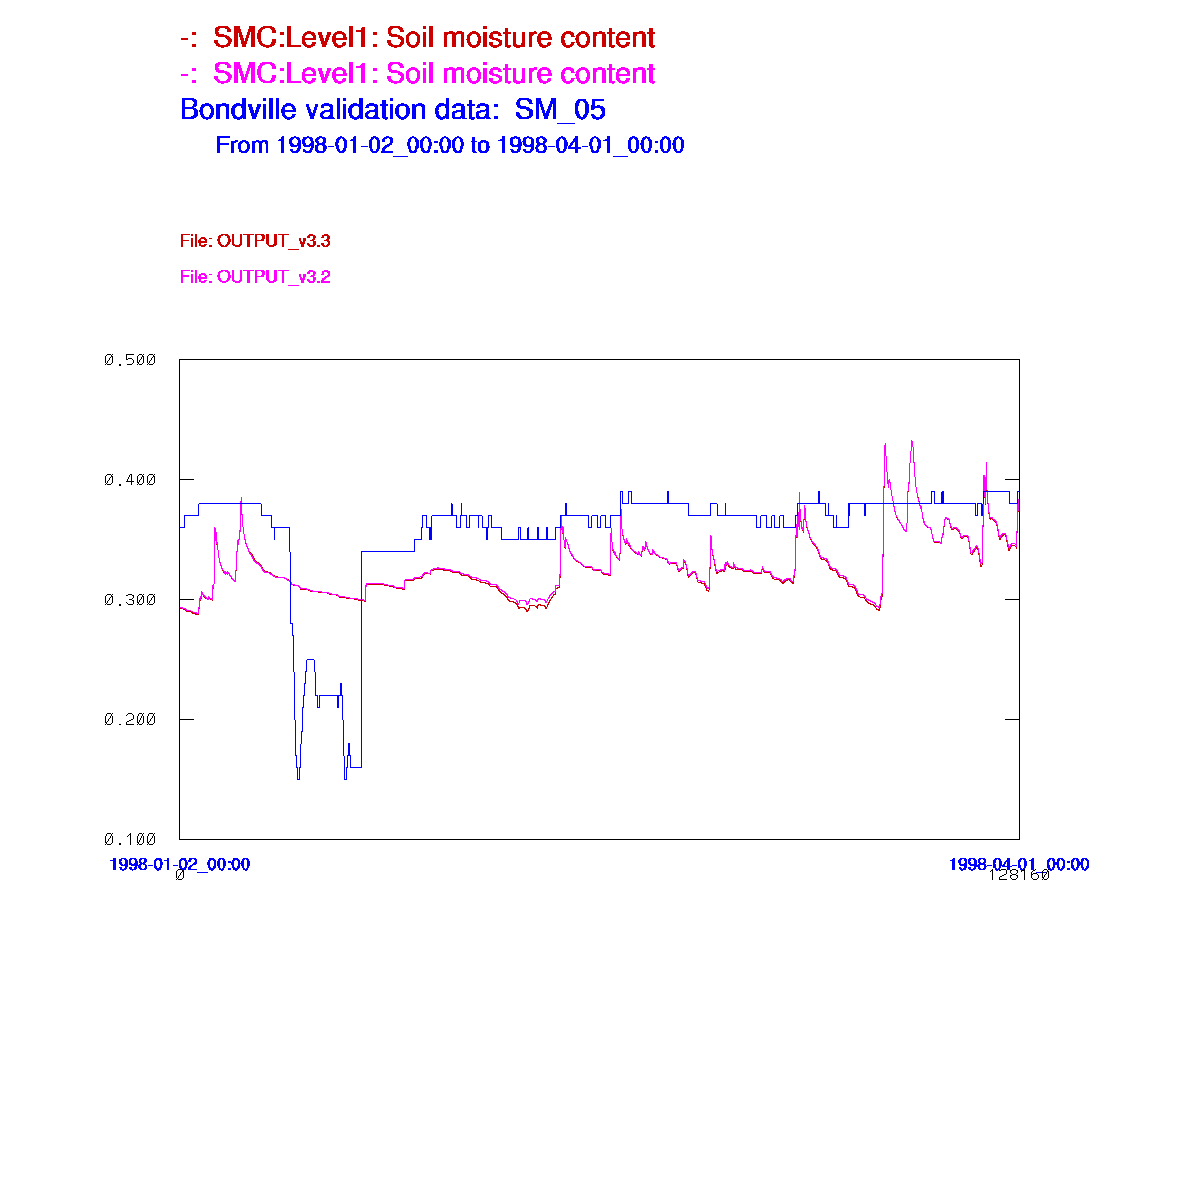
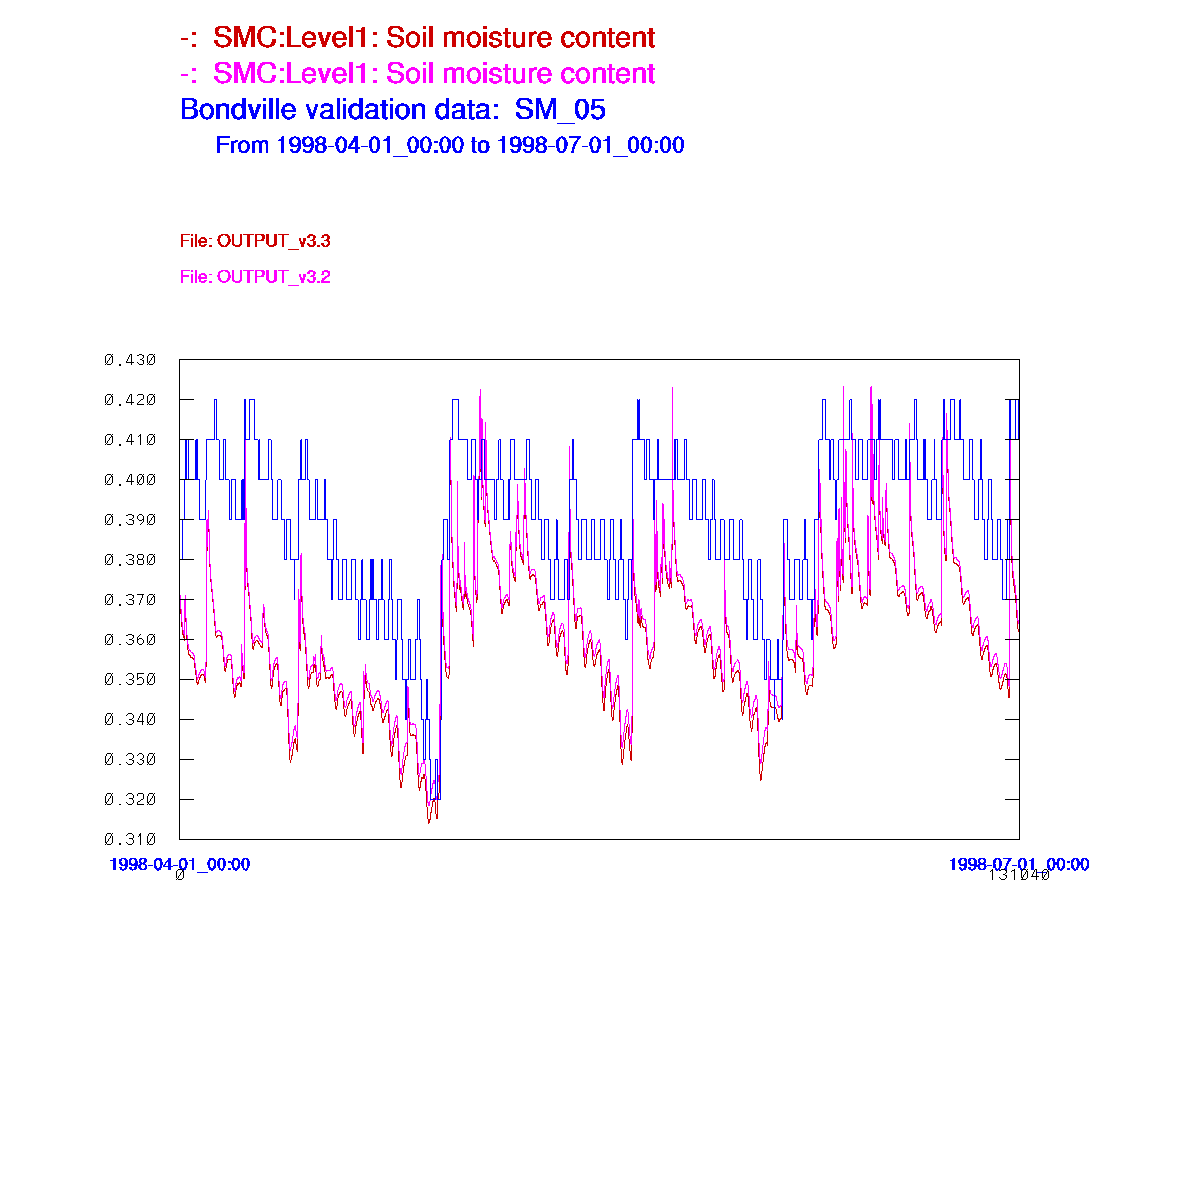
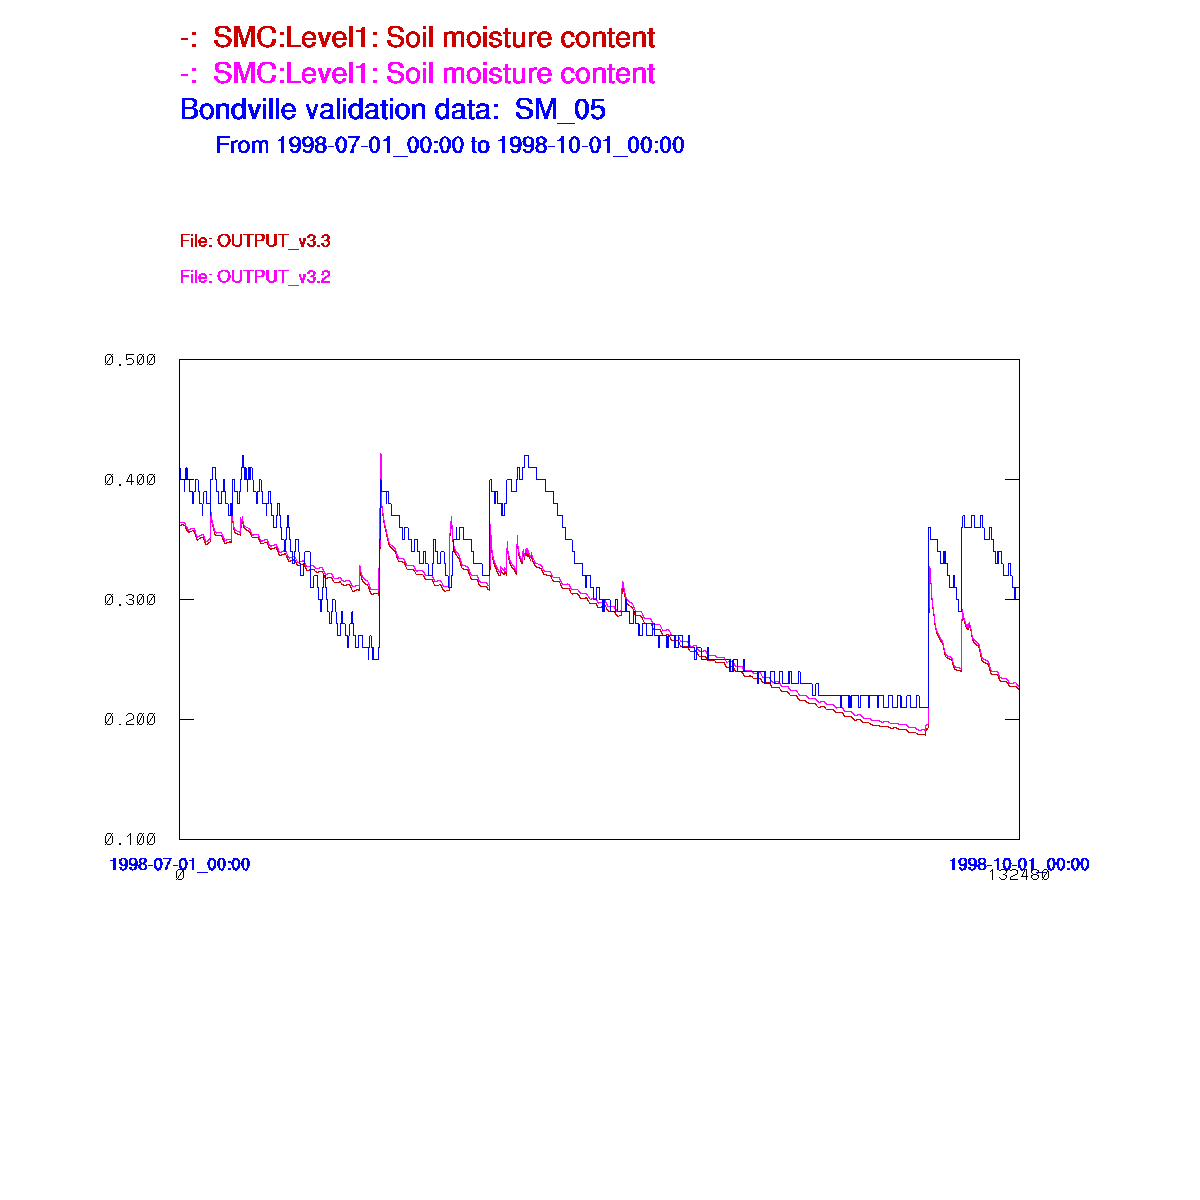
Soil Moisture, Layer 1 (SM1)
Unaveraged time series |
 |
 |
 |
 |
|
Observations (in blue) seem to have fairly low precision.
|
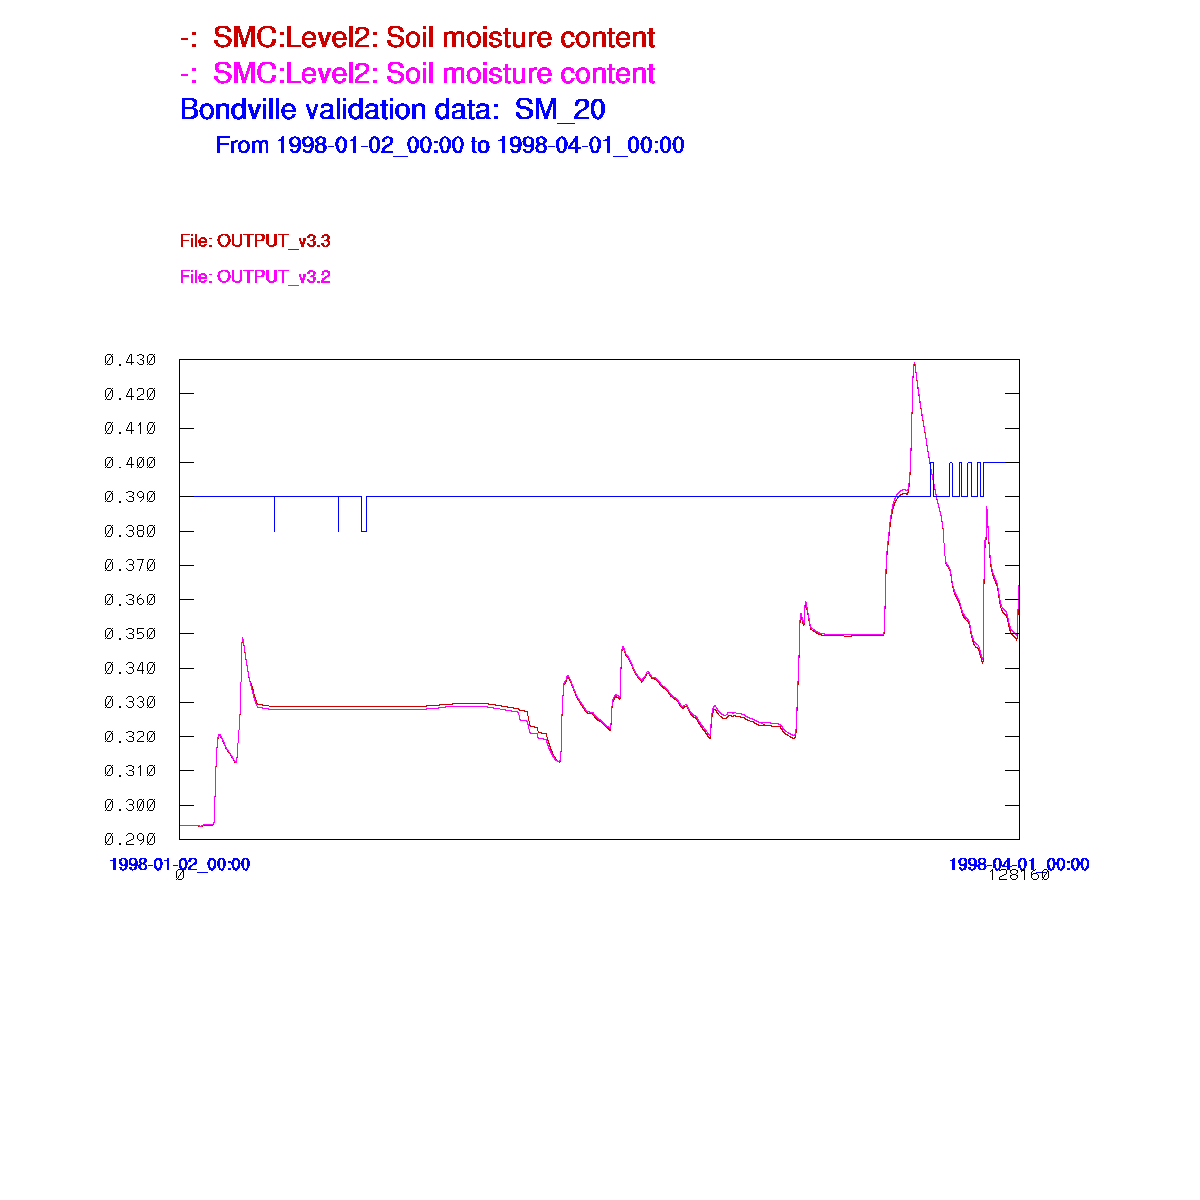
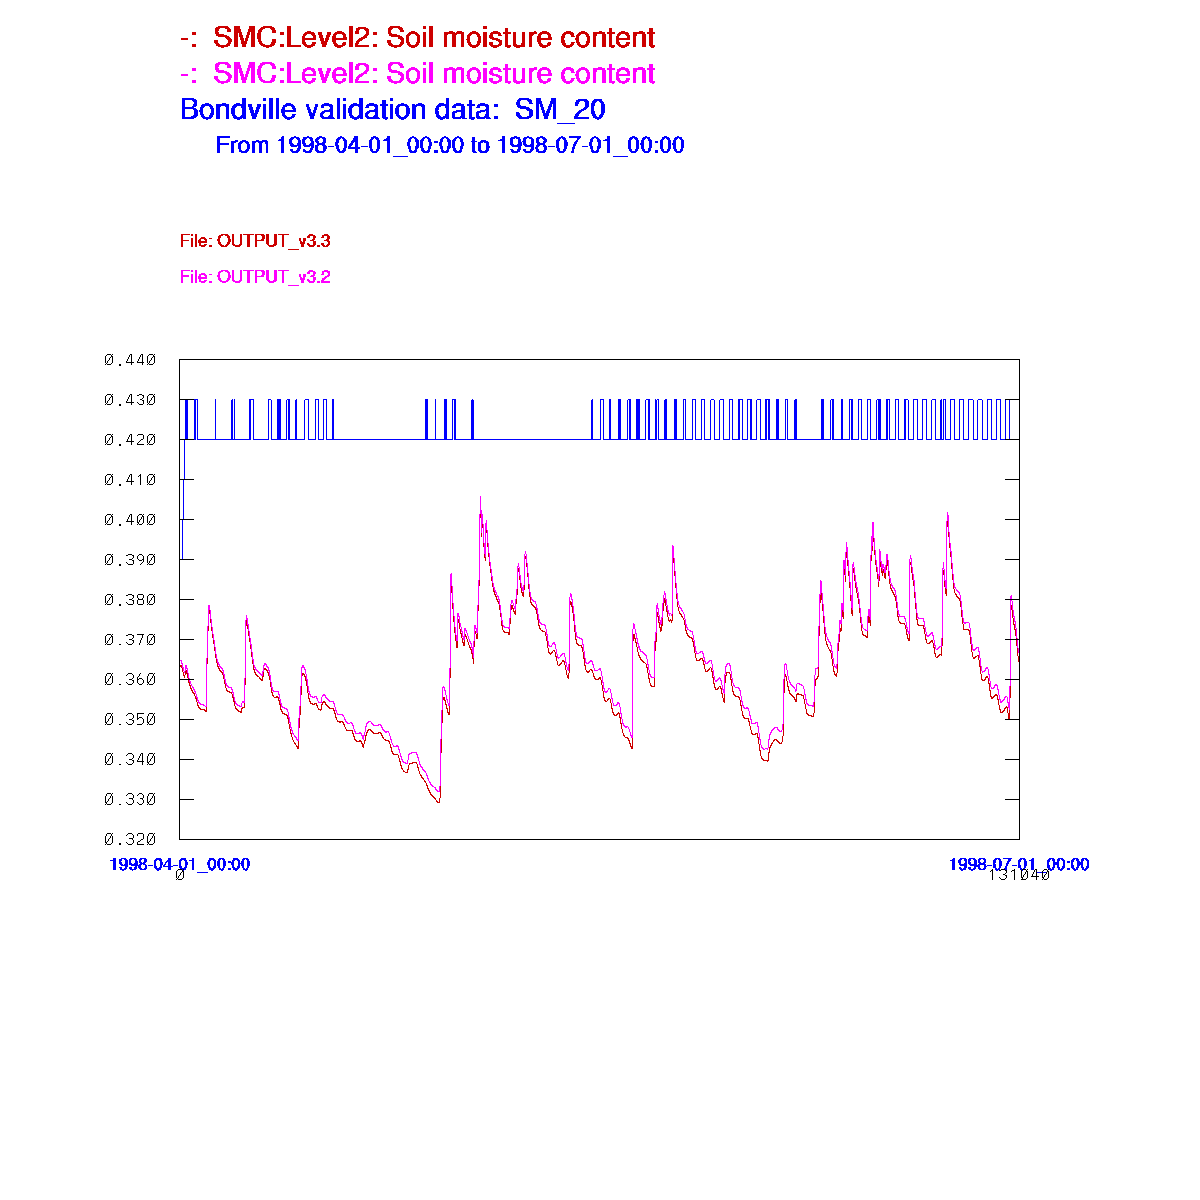
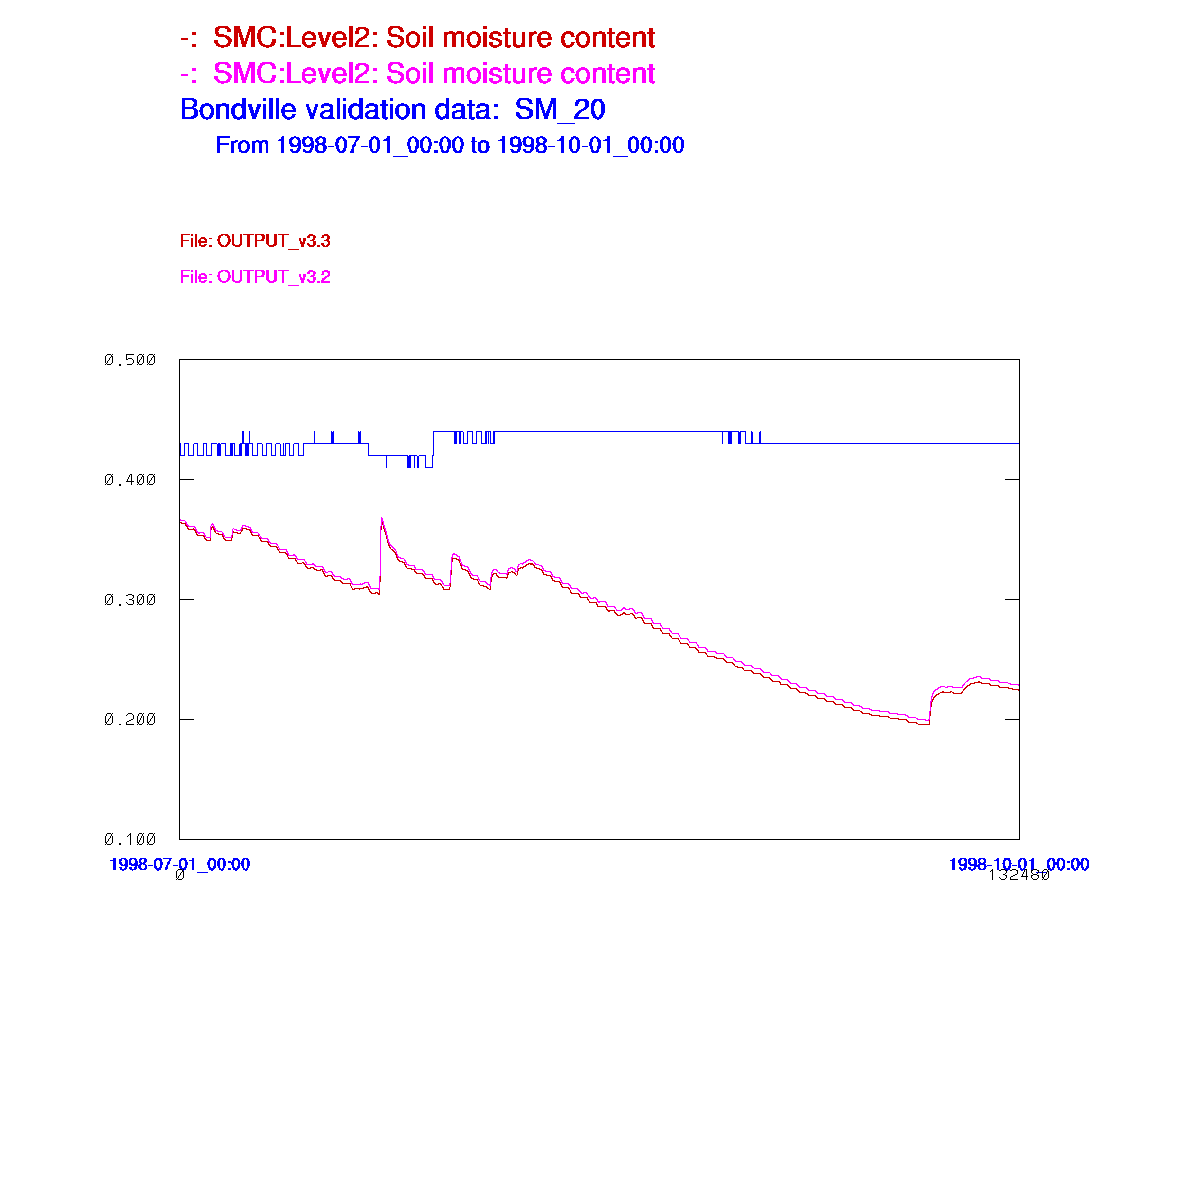
Soil Moisture, Layer 2 (SM2)
Unaveraged time series |
 |
 |
 |
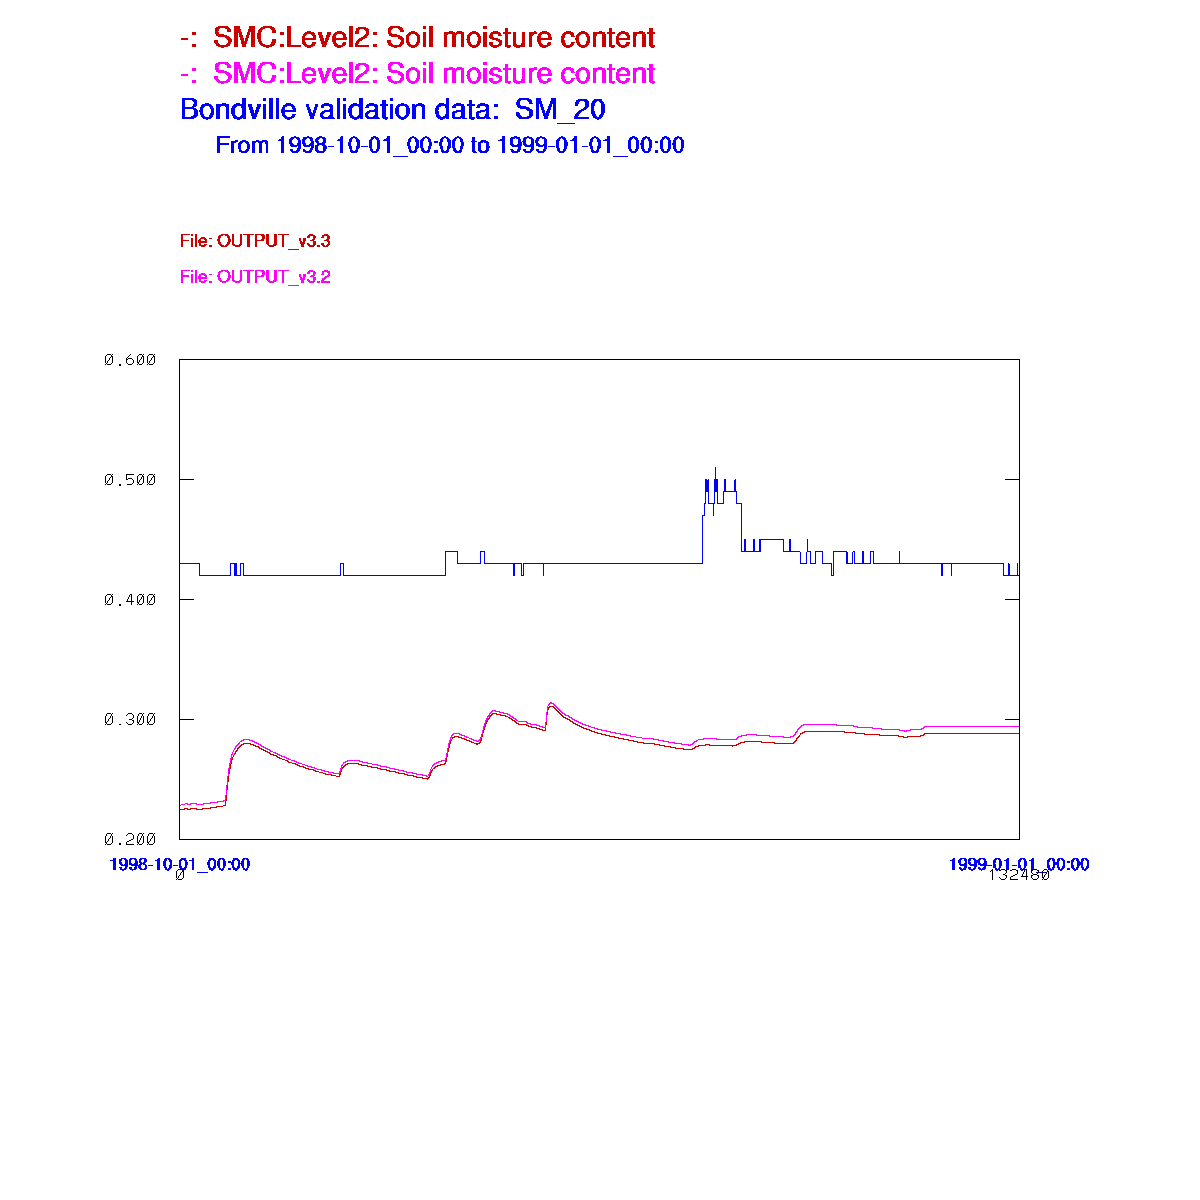 |
|
Observations (in blue) seem kind of suspect to me.
|
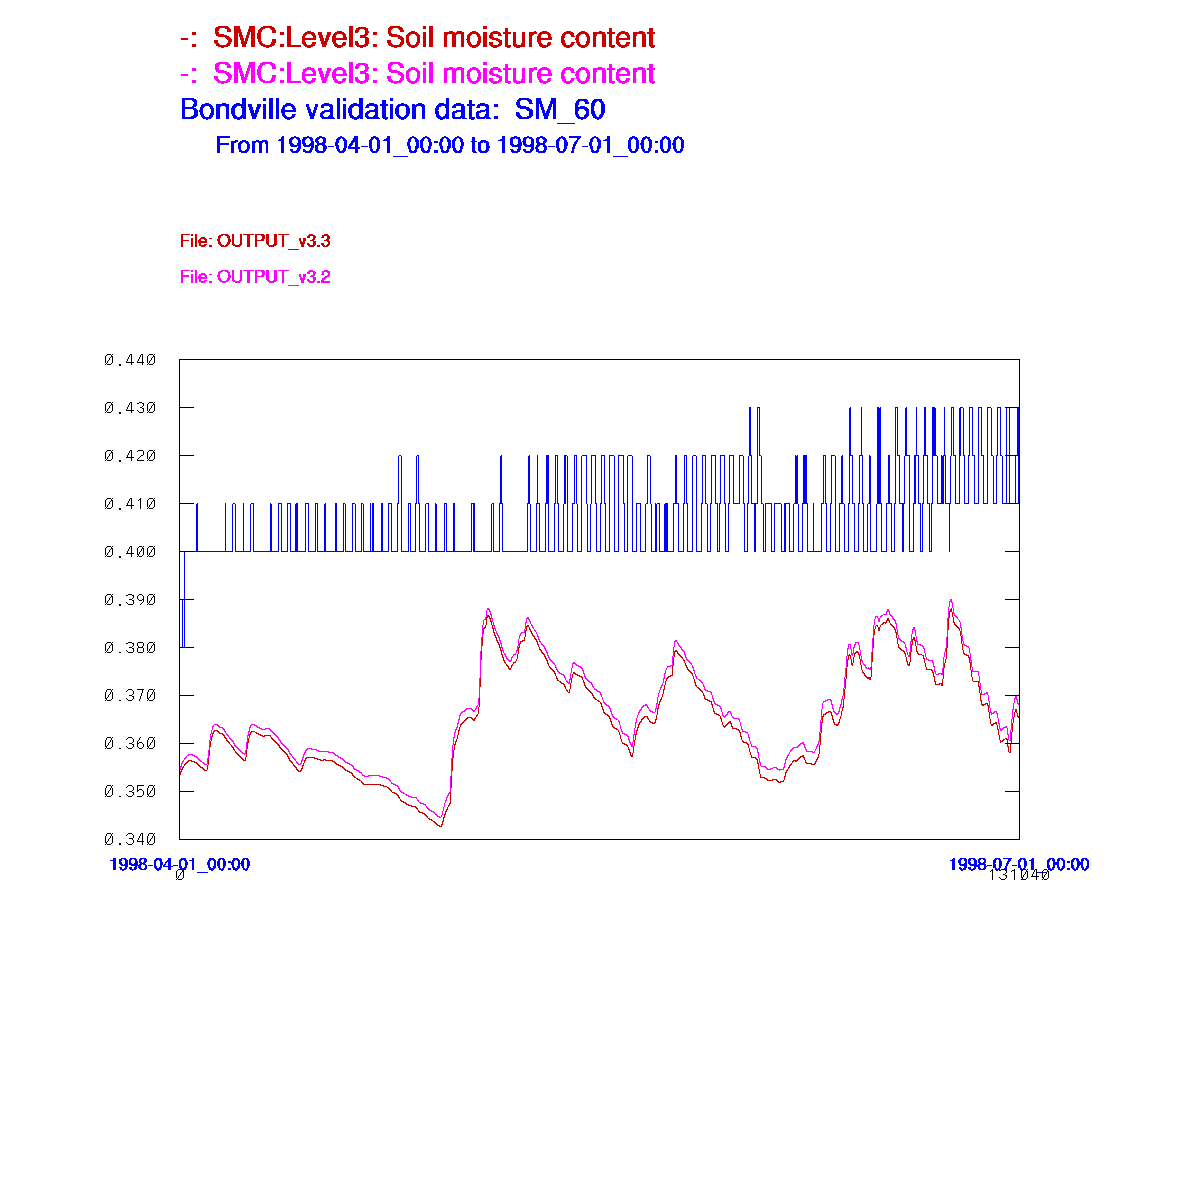
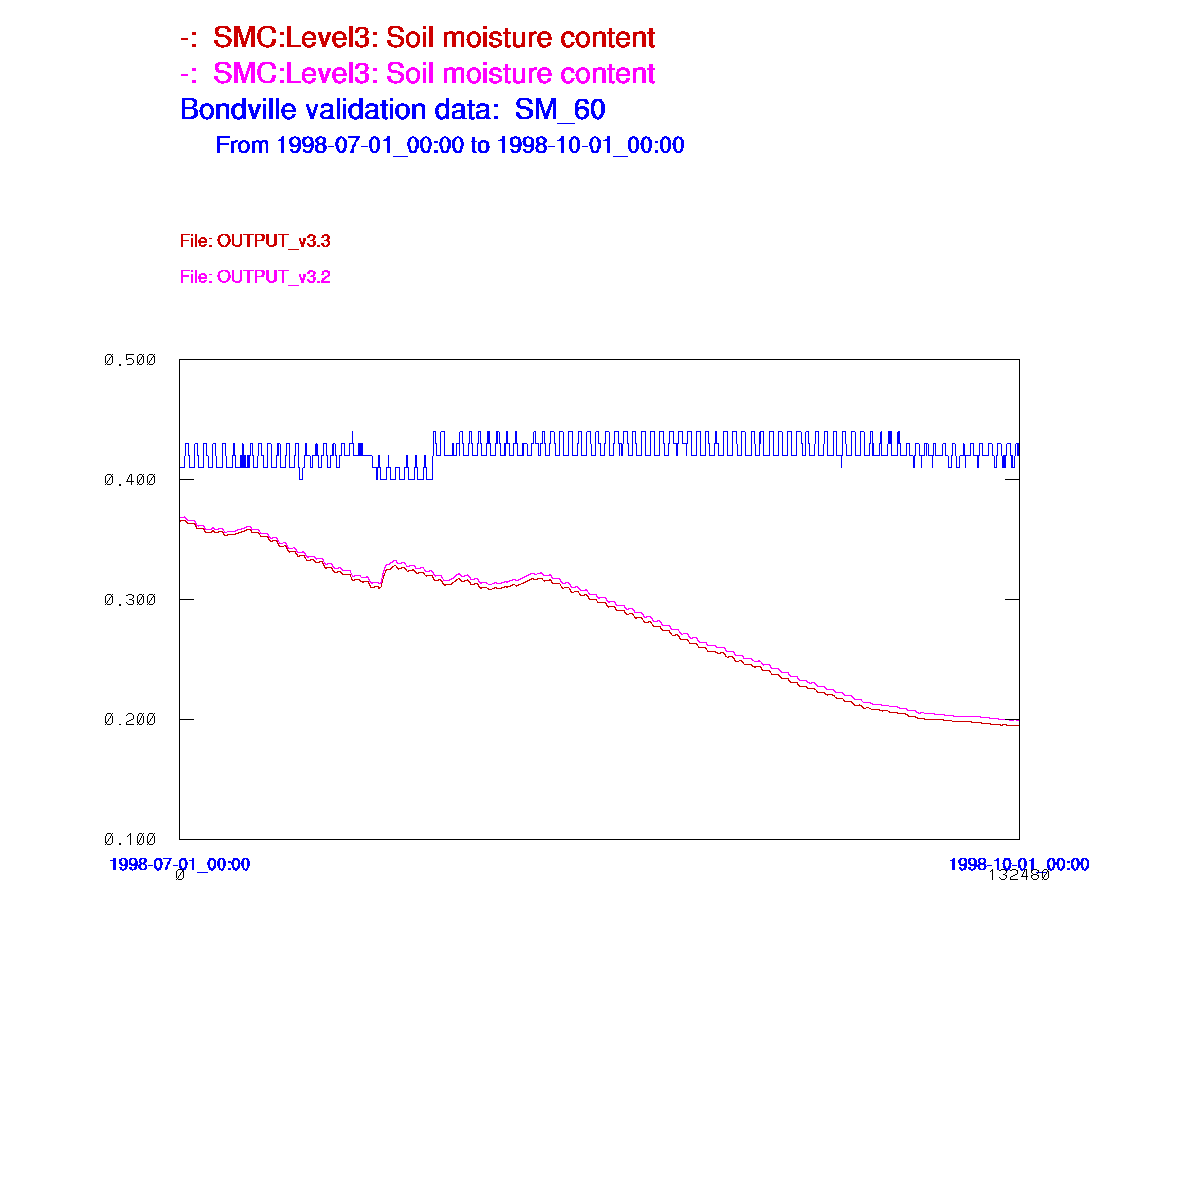
Soil Moisture, Layer 3 (SM3)
Unaveraged time series |
 |
 |
 |
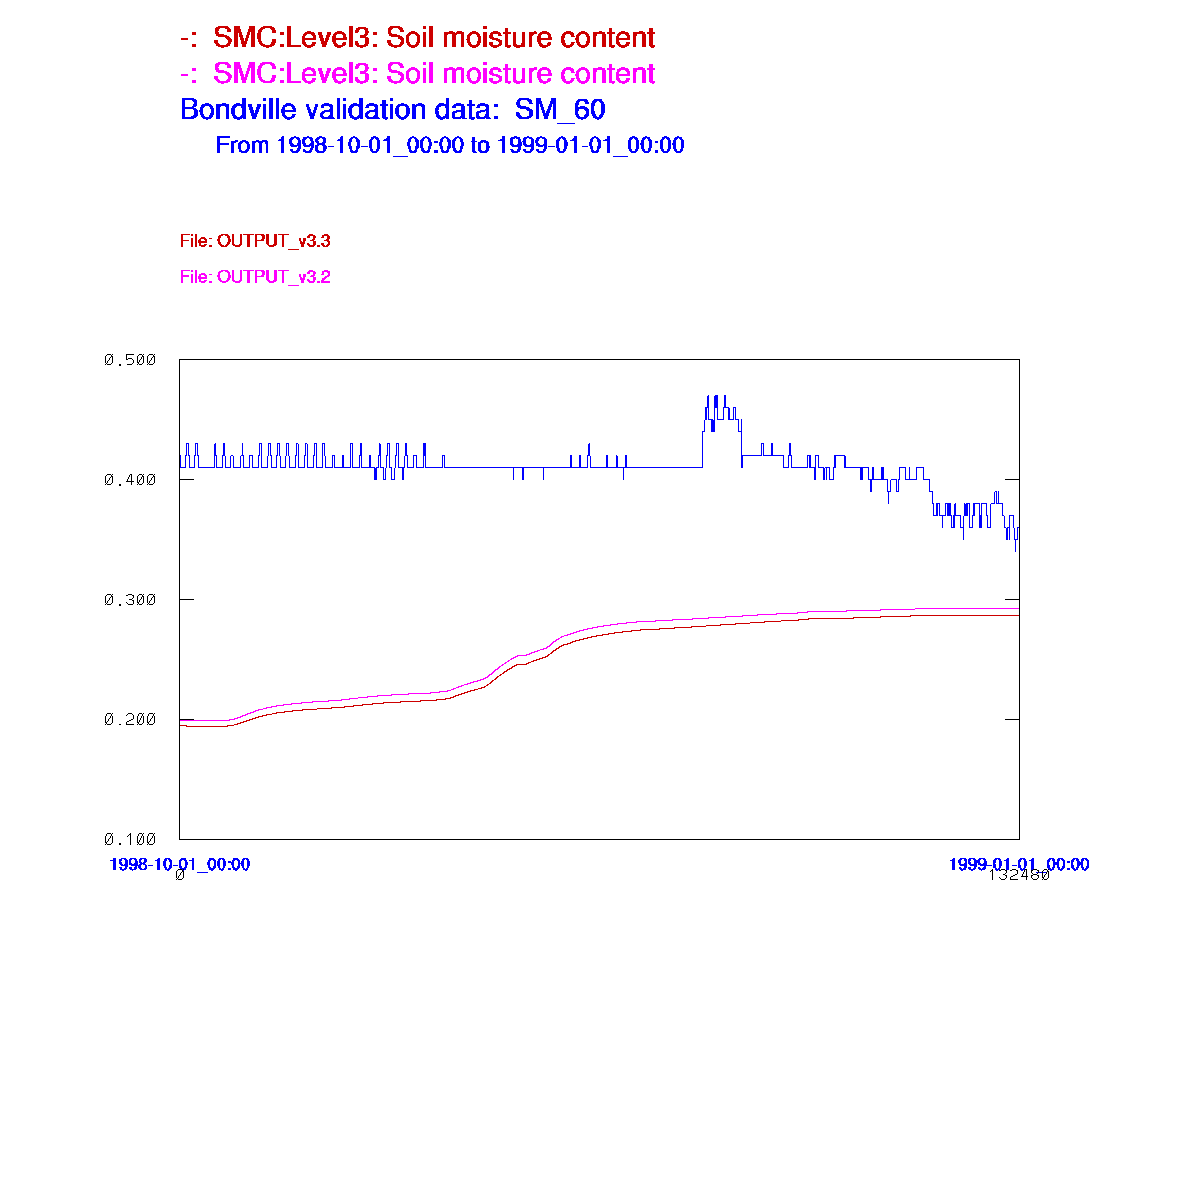 |
|
Observations (in blue) seem suspect to me.
|