Icing Products (CIP/FIP) - Operational

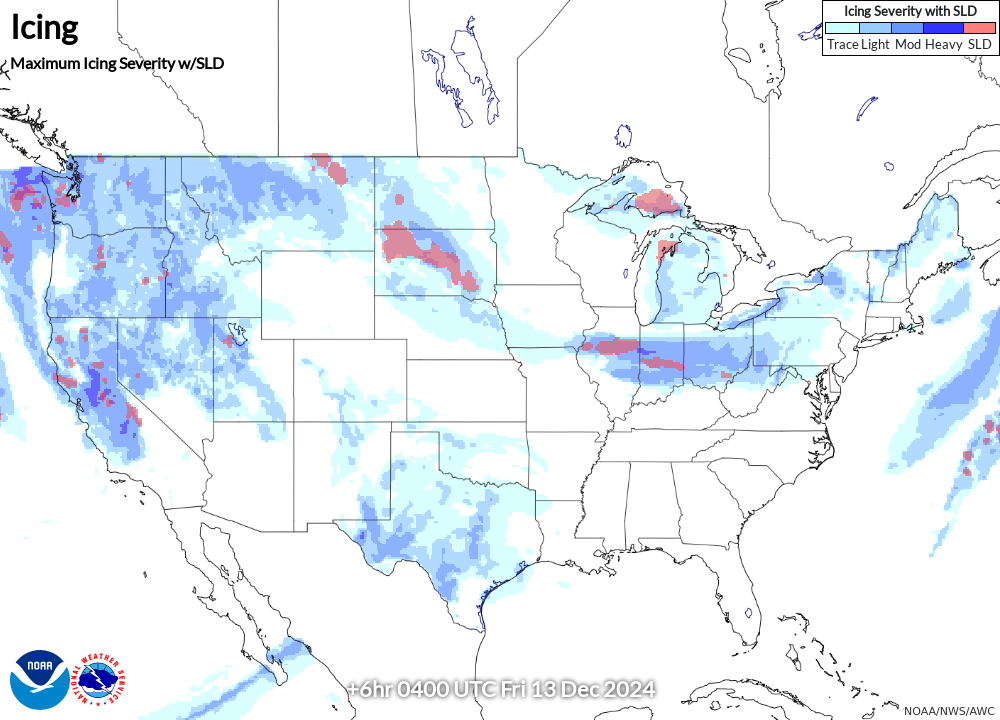
The figure above shows an icing severity forecast produced by FIP. Severity is presented on a categorical scale using blue shading. The red overlays indicate areas with the potential for Supercooled Large Drops.
The Current Icing Product (CIP) combines sensor and Numerical Weather Prediction model output to provide an hourly, three-dimensional diagnosis of the icing environment. The Forecast Icing Product (FIP) is similar to CIP except that it does not include the sensor inputs. CIP/FIP outputs include calibrated icing probability, icing severity, and potential for SLD (supercooled large drop - includes freezing drizzle and freezing rain). Probabilities do not reach 100% because the data available to diagnose icing do not allow for a diagnosis with absolute certainty at any given location in space. Icing severity encompasses five categories (none, trace, light, moderate, and heavy). SLD potential appears as a red hatching.
CIP/FIP are output on a grid with pixels every 13 km in the horizontal and 1000 feet in the vertical. FIP Forecasts extend hourly to 12 h. ADDS displays every other level except on the Flight Path Tool that provides access to all levels. To retrieve a graphic on the Aviation Weather Center icing page, simply alter the desired variable and desired altitude using the selection options at the top. The requested graphic should appear as an image embedded directly in the icing page. Besides the individual levels, you can select a composite, maximum value of all altitudes, labeled "max." This image provides a quick overview of the regional icing threat.
Pilot reports (PIREPs) of icing are overlaid on the single-level graphics (legend found at the bottom of each graphic) if within 1000 ft vertically and 75 min temporally. On the composite graphic, PIREPs for all altitudes are shown (except negative icing reports, which are omitted for the sake of clarity).
Resources
-
Current Icing Potential (CIP): Algorithm description and comparison with aircraft observations
Description
Those interested in learning more details of the science used to create CIP are invited to read the following paper which is available free-of-charge to the public at http://journals.ametsoc.org/doi/pdf/10.1175/JAM2246.1:
-
Bernstein, B.C., F. McDonough, M.K. Politovich, B.G. Brown, T.P. Ratvasky, D.R. Miller, C.A. Wolff and G. Cunning, 2005: Current Icing Potential (CIP): Algorithm description and comparison with aircraft observations. J. Appl. Meteor., 44, 969-986.
-
Contact
Please direct questions/comments about this page to:
Julie Haggerty
Project Scientist III