Agriculture and Air Pollution Dashboard

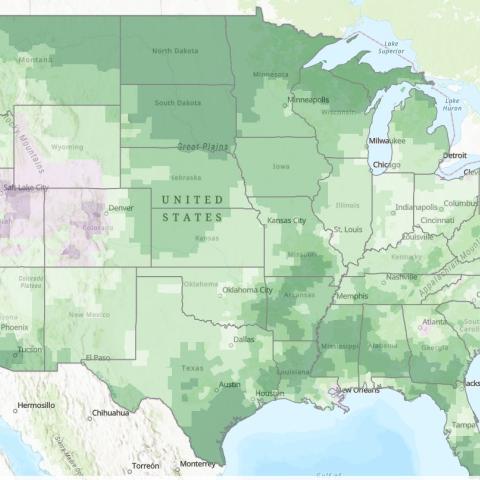
Explore spatial patterns of ozone exposure measurements tied to agricultural health.

The Air Pollution Impact on Vegetation Dashboard explores spatial patterns of W126 and AOT40 Ozone Exposure measurement across the US. W126 and AOT40 are two metrics tied to agricultural health.
Ozone is a secondary pollutant created in the atmosphere when sunlight and NOx triggers a reaction between volatile organic compounds and oxygen. When this gas enters through plant stomata, it can interfere with cellular processes, impacting the growth and yield of various crops.
The W126 Ozone Exposure Index (ppm-hours) shows the potential impact of ozone exposure on vegetation. It is a weighted index that reflects the cumulative hourly daytime exposure index for the highest three-month period in a year and is linked to crop-specific yield functions that reflect the impact of ozone on crop production. W126 concentrations are controlled as a secondary standard by the US EPA and the limit is a three-year average of 17 ppm-hours.
Contact
Please direct questions/comments about this page to: