Air Quality Dashboard

Explore past modeled annual concentration trends of air quality over the continental US.

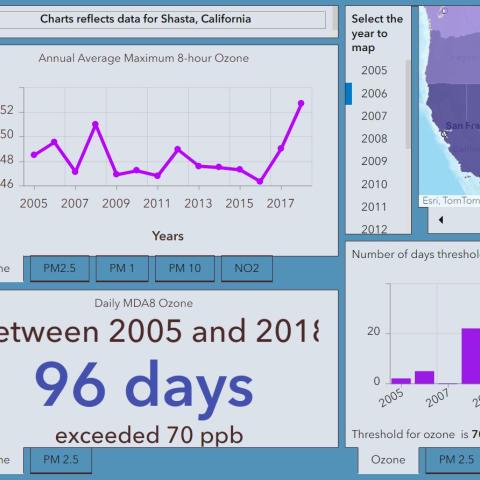
The Air Quality Dashboard enables exploration of past (2005-2018) air quality annual concentration trends of ozone, PM1, PM2.5, PM10, and NO2 over the continental US.
The overarching goal of this project has been to quantify and attribute past (2005-2018) air quality trends in terms of ozone and PM2.5 over the US via assimilation of NASA atmospheric composition observations. We focus on 2005-2018 because of the simultaneous availability of the Moderate Resolution Imaging Spectroradiometer (MODIS) aerosol optical depth (AOD), Measurement of Pollution in the Troposphere (MOPITT) carbon monoxide (CO), and Ozone Monitoring Instrument (OMI) retrieved tropospheric column NO2 retrievals.
The data was created using the Community Multiscale Air Quality (CMAQ) model which is a comprehensive multipollutant air quality modeling system developed and maintained by the US Environmental Protection Agency's (EPA) Office of Research and Development (ORD). CMAQ combines current knowledge in atmospheric science and air quality modeling, multi-processor computing techniques, and an open-source framework to deliver fast, technically sound estimates of ozone, particulates, toxics and acid deposition. In this project, we used CMAQ to simulate the gridded distribution of ozone, precursor gasses, fine particulate matter (PM2.5), aerosol chemical composition, and aerosol optical properties at 12 x 12 km2 over the CONUS from 1 Jan 2005 to 31 Dec 2018. The meteorological fields required to drive CMAQ were also simulated at 12 x 12 km2 grid spacing using the Weather Research and Forecasting Model (WRF) that uses a larger domain than CMAQ with 481 and 369 grid points in the longitudinal and latitudinal directions, respectively, and 43 vertical levels stretching from the surface to 50 hPa.
Contact
Please direct questions/comments about this page to: