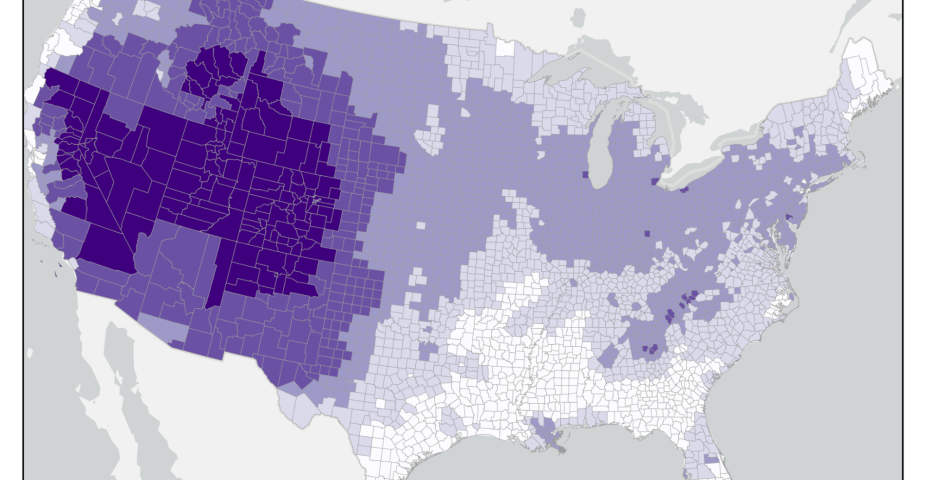
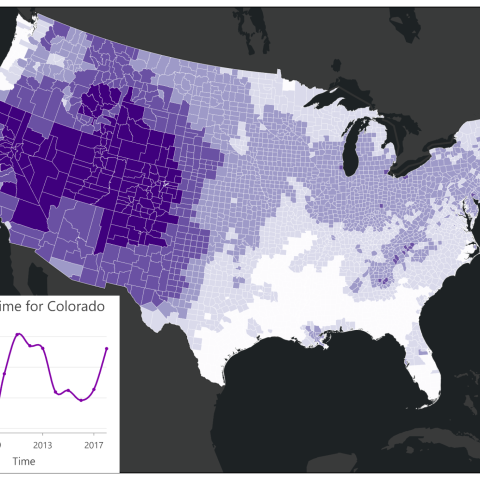
Air Quality Index Dashboard

Download air-quality data as a CSV file from the CMAQ model, aggregated spatially and temporally.

The Air Quality Index User Dashboard provides easy access to air quality data from the CMAQ model for the time period of 2005-2018 aggregated spatially and temporally based on users needs as CSV files.
Office of Research and Development (ORD). We used CMAQ to simulate the gridded distribution of ozone, precursor gasses, fine particulate matter (PM2.5), aerosol chemical composition, and aerosol optical properties at 12 x 12 km2 over the CONUS from 1 Jan 2005 to 31 Dec 2018. The meteorological fields required to drive CMAQ were also simulated at 12 x 12 km2 grid spacing using the Weather Research and Forecasting Model (WRF) that uses a larger domain than CMAQ with 481 and 369 grid points in the longitudinal and latitudinal directions, respectively, and 43 vertical levels stretching from the surface to 50 hPa.
Contact
Please direct questions/comments about this page to: