
Air Quality Forecasting
A major global environmental risk to both our health and food security
Air Quality Forecasting
A major global environmental risk to both our health and food security
Air pollution is estimated to cause about 3.7 million premature deaths worldwide and destroy enough crops to feed millions of people every year, and is thus a major global environmental risk to both our health and food security.
NSF NCAR has more than two decades of experience in developing advanced community models that are widely used for both air quality prediction and research. Scientists are working in collaboration with other agencies to develop new technologies to:
- Forecast air quality for cities and rural areas days in advance.
- Project impact of future changes in human activities and climate on air quality.
- Quantify cross-border transport of air pollution.
- Quantify regional transport of air pollutants within a country.
- Assess societal impacts of air pollution
- Improve emission estimates.
Improving 48-h predictions of fine particulate matter (PM2.5) over the U.S.
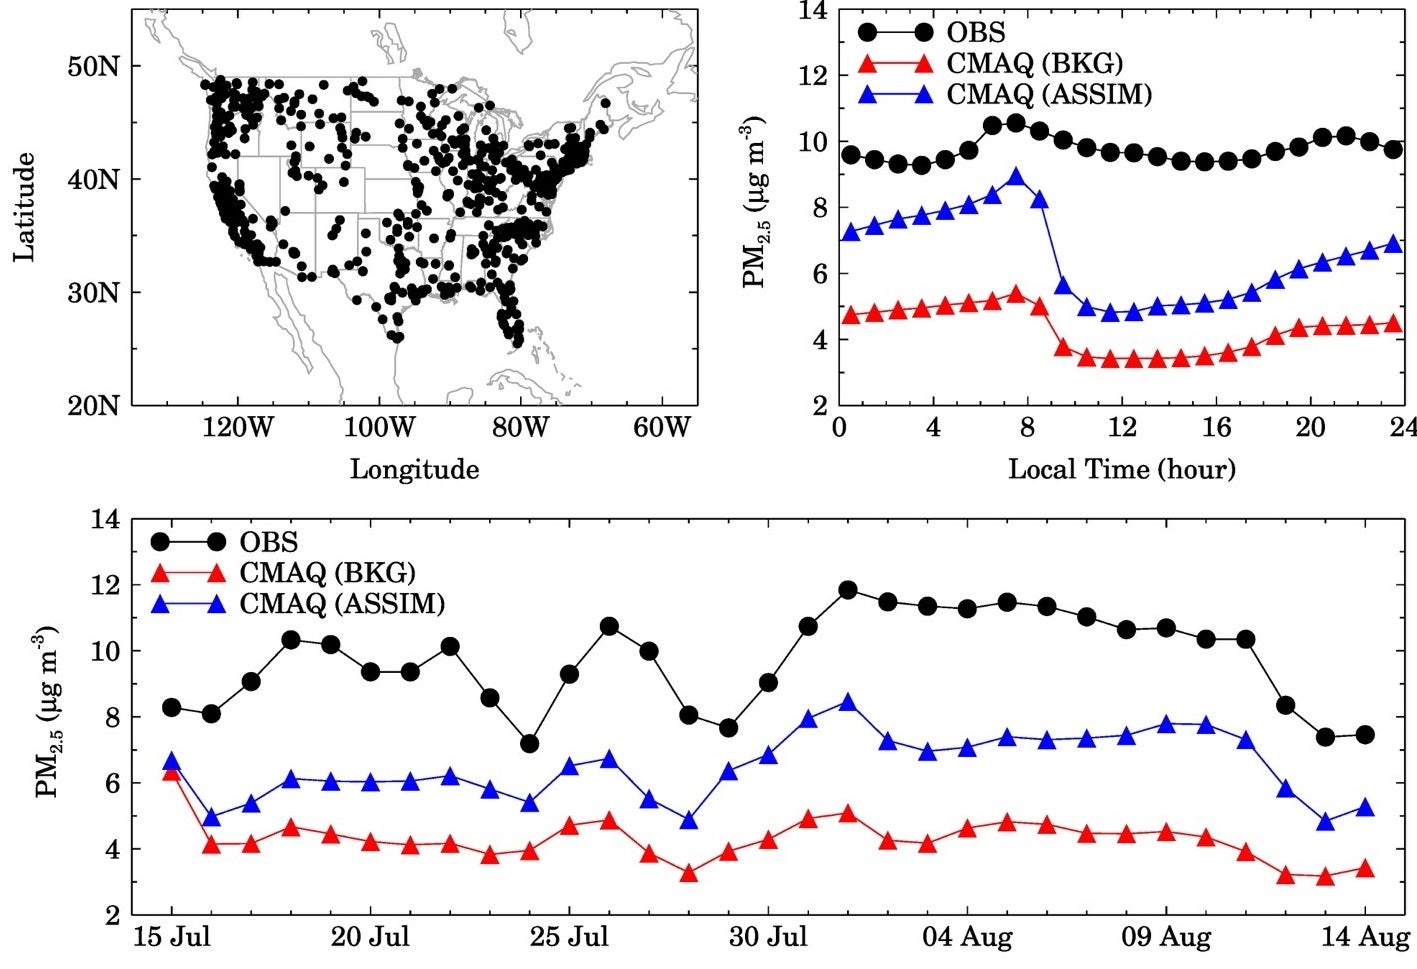
Figure 1: Top left panel shows EPA PM2.5 monitoring sites used for evaluation of CMAQ simulated PM2.5 mass concentrations. The comparisons of the observed and CMAQ simulated diurnal and daily variability of PM2.5 averaged over all the sites during 15 July to 14 August 2014 for three CMAQ experiments are shown in the top right and bottom panels, respectively. Standard deviation in the average observed values range from 4.8 to 11.9 µg/m3, and those in CMAQ average value range from 2.7 to 7.5 µg/m3. BKG represents the CMAQ experiment without assimilation and ASSIM represents CMAQ experiment with AOD assimilation.
In an effort funded by NASA, NSF NCAR and its partners have developed a new capability to produce 48-hour detailed forecasts of ground level ozone and fine particulate matter. The new forecasting capability combines satellite and in-situ observations with state-of-the-art air quality modeling capabilities. It is generating more detailed, probabilistic air quality forecasts compared to the current forecasts, which provide just a single-value prediction and do not specify the uncertainty associated with the prediction. Just as a weather forecast, for example, might warn of a 80% chance of rain in the afternoon, new air quality forecasts may warn of a 80% chance of high ozone levels during certain times of the day while the current forecasts only tell whether ozone will be high or low. Such detailed forecasts can significantly enhance the decision-making activity in air quality management. The system has been set up over the USA but can be easily applied to any part of the world.
The first objective of the ongoing project is to improve the initialization of the National Oceanic and Atmospheric Administration (NOAA) / National Centers for Environmental Prediction (NCEP) operational air quality system, which is based on the Community Multiscale Air Quality (CMAQ) model, through chemical data assimilation of satellite retrieval products with the Community Gridpoint Statistical Interpolation (GSI) system. We use GSI to assimilate retrievals of aerosol optical depth from the NASA Aqua/Terra Moderate Resolution Imaging Spectroradiometer (MODIS) satellite instruments to improve predictions of particulate matter of aerodynamic matter of less than 2.5 µm (PM2.5) over the United States. The assimilation of MODIS AOD in CMAQ improves the model’s ability to simulate day to day variability, i.e., the correlation coefficient by ~67% and reduces the mean bias by ~38% (Figure 1).
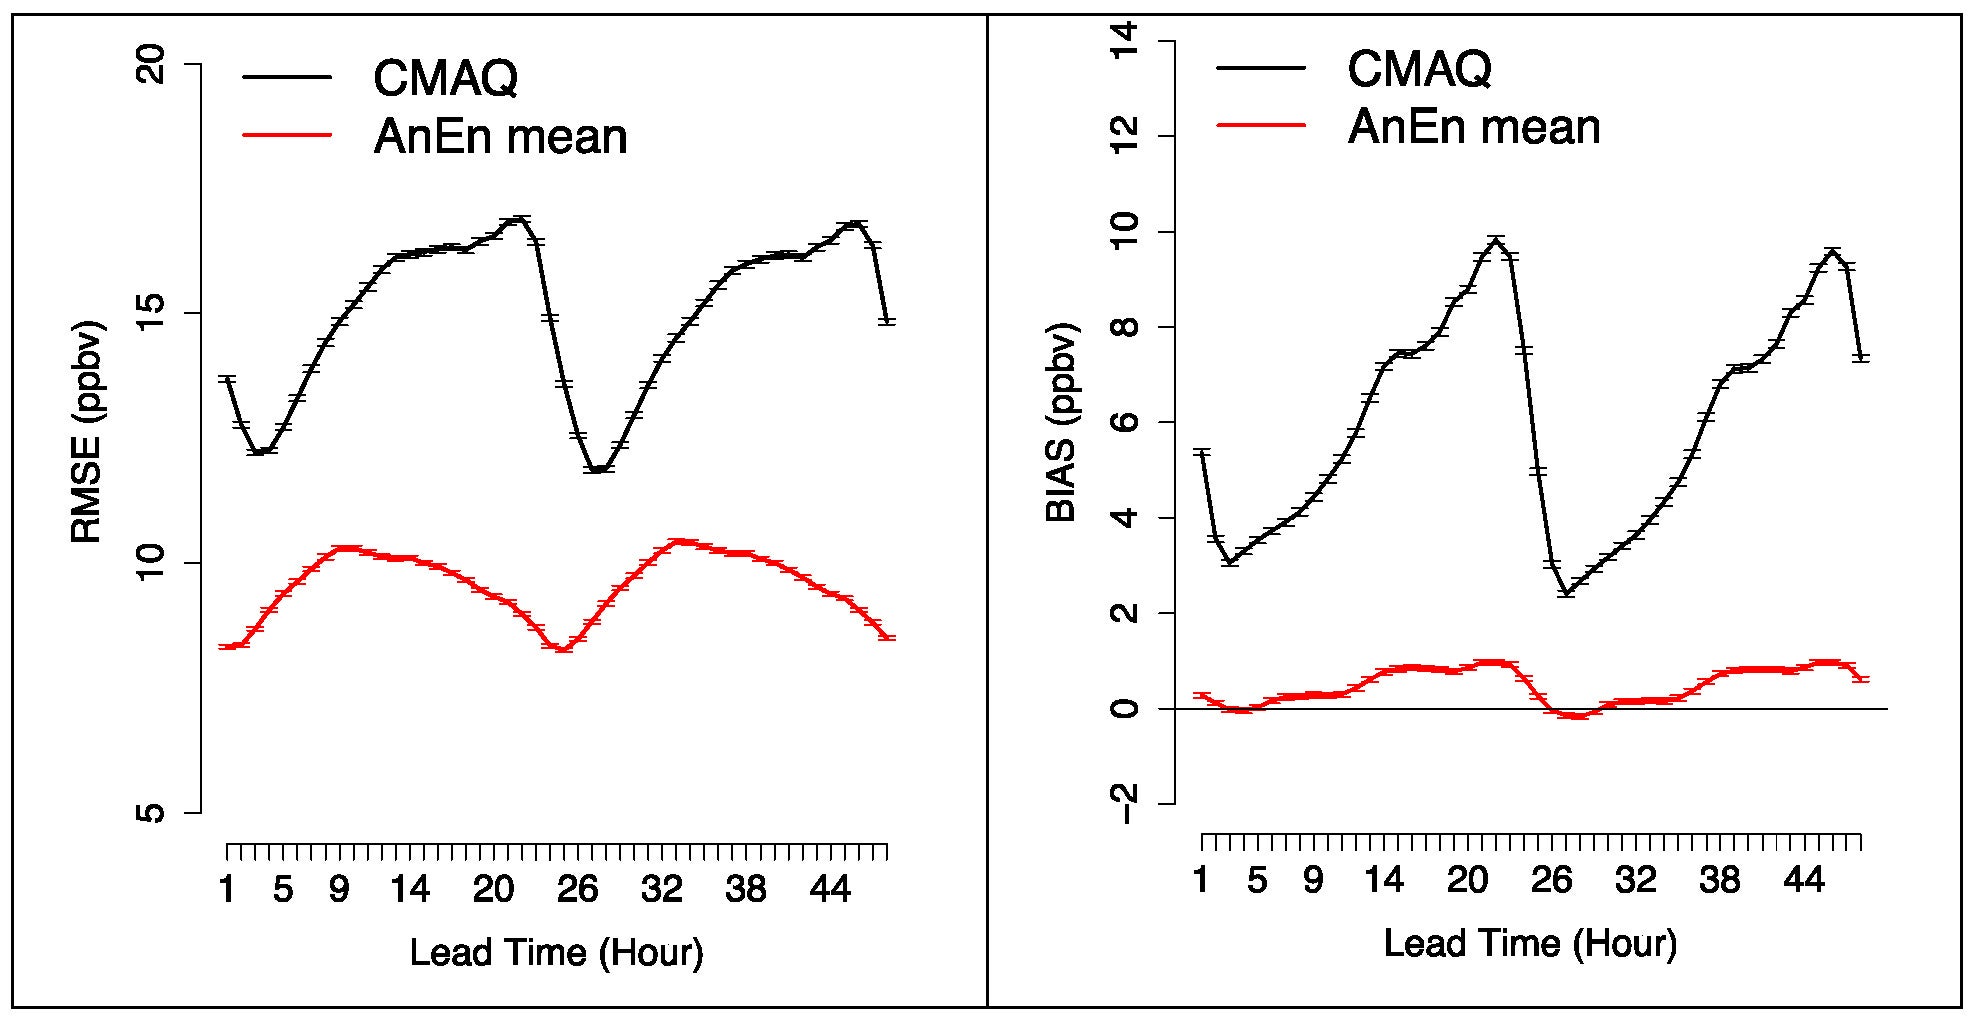
Figure 2: Root Mean Squared Error (RMSE) and BIAS as a function of forecast lead time for the AnEn mean (red) and CMAQ (black) forecasts of O3 concentrations over all the available stations for the period of June 2015-September 2015. The vertical bars indicate the 5-95% boot strap confidence intervals.
The second objective is to improve the CMAQ deterministic predictions and reliably quantify their uncertainty with analog-based post-processing methods applied to the CMAQ deterministic predictions. The AnEn technique (Delle Monache et al. 2013) has been extensively tested for the probabilistic prediction of both meteorological variables and renewable energy (Alessandrini et al. 2015). The AnEn is built from a historical set of deterministic predictions and observations of the quantity to be predicted. For each forecast lead time and location, the ensemble prediction of a given variable is constituted by a set of measurements of the past (i.e., 1-hour averages of O3 concentrations). These measurements are those concurrent to past deterministic predictions for the same lead time and location, chosen based on their similarity to the current forecast. The forecasted variables used to identify the past forecast similar to the current one are called analog predictors. In this application we use as predictors wind speed, wind direction, 2-m temperature, cloud cover, PM2.5, and O3 concentrations forecasts over the continental U.S. generated with CMAQ. The AnEn has been successful tested for the deterministic and probabilistic prediction of both PM2.5, and O3. The Analog-predictor weights are obtained independently at each station by an optimization algorithm which minimizes the continuous ranked probability score (CRPS) over May 2015.
In Figure 2, we compare the CMAQ and the AnEn mean forecasts. The AnEn mean consistently improves the CMAQ forecast by significantly decreasing both the RMSE and the BIAS. We have also look at several attributes of probabilistic predictions, and similarly to other applications, the analog ensemble is statistically consistent, and it is able to reliably quantify the uncertainty of the prediction.
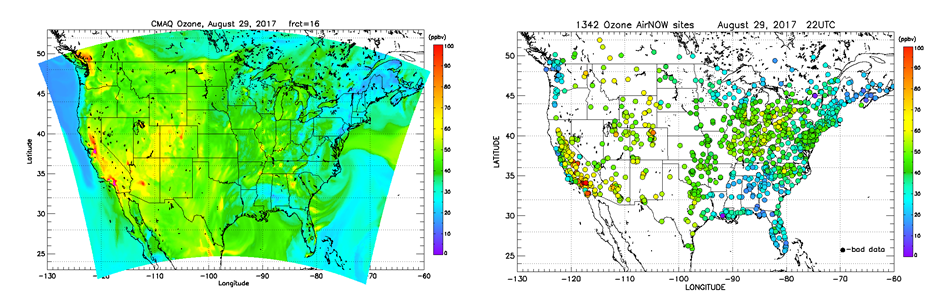
Figure 3. CMAQ Ozone gridded forecast data on the left and corresponding observed data on the right for August 29, 2017, 22 UTC.
The third objective is the extrapolation of deterministic and probabilistic point-based predictions to a two-dimensional grid over the U.S. with a Barnes-type iterative objective analysis scheme. Figure 3 shows an example of this technique, which is currently considered for operational implementation as part of the NOAA operational air quality prediction system.
The proposed effort is led by NSF NCAR, in collaboration with NOAA, CU Boulder, and the University of Maryland. Currently, NOAA/NCEP is running operationally in real-time the deterministic analog-based correction for the prediction of ground level ozone and surface PM2.5.
Improving air quality forecast over Delhi
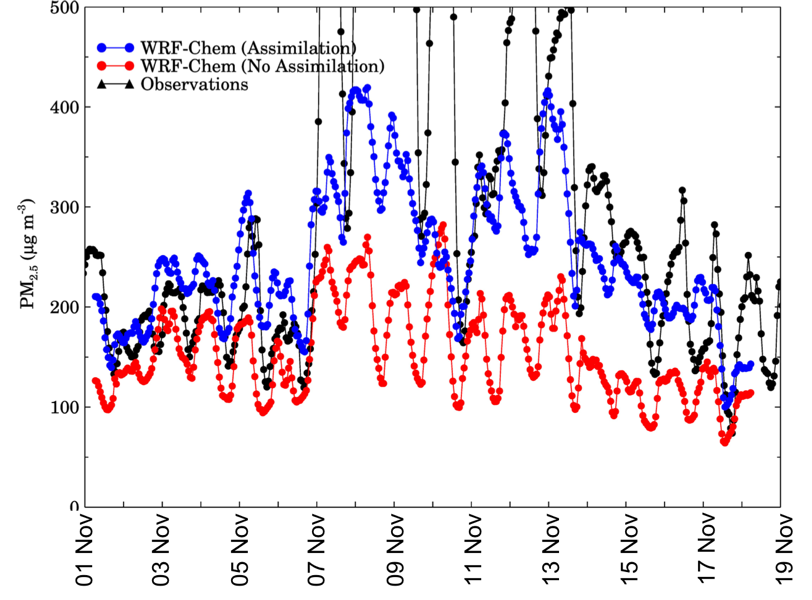
Figure 4: Time-series of observed and WRF-Chem simulated surface PM2.5 mass concentration with and without assimilation of MODIS AOD retrievals
NSF NCAR is leading another effort in collaboration with the Indian Institute for Tropical Meteorology (IITM), an autonomous institution of the Ministry of Earth Sciences of India, to develop an air quality forecasting system to enhance the decision-making activity in the area of air quality. The forecasting system synergistically integrates MODIS AOD retrievals with the WRF-Chem modeling system to improve forecasts of surface PM2.5 in Delhi. The system was tested for the period of 1-20 November 2017, during which air quality became hazardous in Delhi (Figure 4). The assimilation of MODIS AOD reduces the bias in surface PM2.5 mass concentration by up to 200 ug/m3 especially during 07-13 Nov 2017 when the observed surface PM2.5 regularly exceeded 500 ug/m3. The system is being used to forecast air quality for 72 h in advance right now and is helping the decision-makers mitigate the risk of air pollution in Delhi and surrounding regions.
Contact
Rajesh Kumar
Deputy Director