Improving Hurricane Forecasting
NCAR’s New Display and Diagnostic System
Saving lives and mitigating property losses—that’s what NOAA’s National Hurricane Center (NHC) is all about. And the 2017 tropical weather storms, Harvey, Irma and Maria, among other less notorious hurricanes, certainly put the 24/7 operation through its paces. Using the best, most current technology and skilled manpower, it issues watches, warnings, forecasts, and analyses of hazardous tropical weather. For it to meet its mission, it depends on its partners, including NCAR, to evaluate the accuracy and efficacy of its forecasts, ensuring communities stay safe from tropical weather threats. NCAR researchers were tasked to develop a display and diagnostic tool to help evaluate and improve the accuracy of hurricane track and intensity forecasts, with NOAA funding.
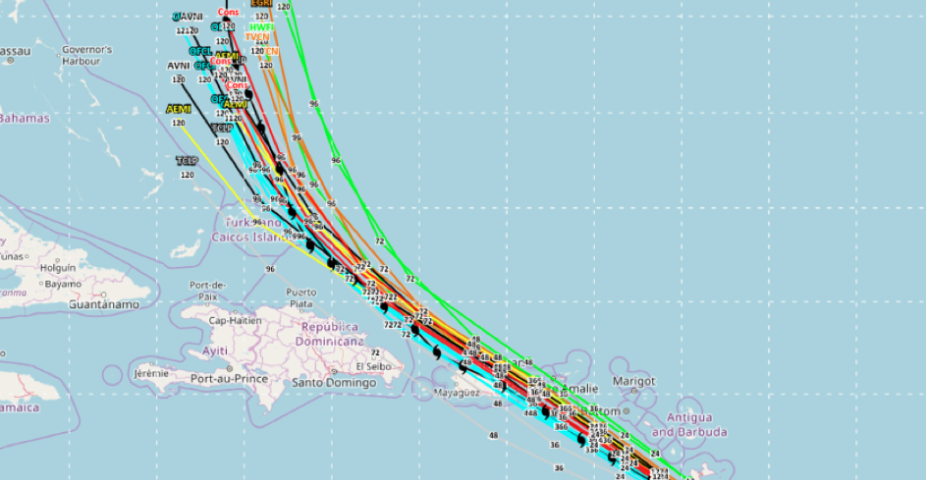
 and the forecast just before it made landfall in Dominica.")

For operations and research meteorologists, the hurricane season does not end on November 1. Post-season analysis is just as important as real-time forecasting. The Hurricane Center plans to use this new web-based display and diagnostic system to evaluate how well their forecasts did. Users will be able to scrutinize what models worked well (and not well) under various conditions they select with tool. It offers additional capability in addition to the current technology being used at NHC. The tool is a web-based system that provide the flexibility to run on any computer platform. Users of it will appreciate its new functionality to conduct diagnostic evaluation to hurricane track in intensity forecasts. For example, they will be able to analyze whether certain models track too far to the right for intense storm or too far left of the actual track. Its flexibility allows the user to fold in sea surface temperature observations, for example, to see the impact on storm intensity. The tool is flexible and adaptable and can also use other dataset such as satellite, radar and gridded model output to evaluate hurricane forecasts.
“This puts all the data in a nice, neat package,” stated Paul Kucera, scientist in the Research Application Lab at NCAR.
The pilot phase of this project will begin later this year, after the season simmers down. The software will be installed at the National Hurricane Center in Florida and users of it will be trained by the NCAR developers. “Our goal is to have the operational version by next hurricane season [2018] and support it as needed. If users want particular features added to it, we will incorporate them to make it even better over time,” said Kucera.
It won’t be used solely for operations purposes. It will be an open community resource, available to anyone who wants to use it. University faculty and students will be able to use it for teaching and research purposes. The public version is available at: http://www.hfip.org/nhc-display