STEP Hydromet Experiment
The STEP Hydromet Experiment, centered over the Colorado Front Range, will run from 1 June – 31 August 2017 to test the predictive skill of the STEP Hydromet Rainfall Prediction System. Running this system in real-time for the fourth summer in a row, we continue to work on making substantial advances toward the STEP goals of improving short–term prediction of high–impact weather, particularly heavy rainfall and flash flooding. This fully-integrated hydrometeorological system includes:
- quality-controlled, radar-based quantitative precipitation estimation (QPE) and rain gauge QPE,
- quantitative precipitation forecasts (QPF) from state-of-the art WRF 3D-Var NWP models with radar data assimilation and 1 and 3 h update cycles,
- radar echo extrapolation and precipitation accumulation nowcasts (QPN) from 10 min – 1 h from the heuristic-based AutoNowcaster(ANC)/Trident system,
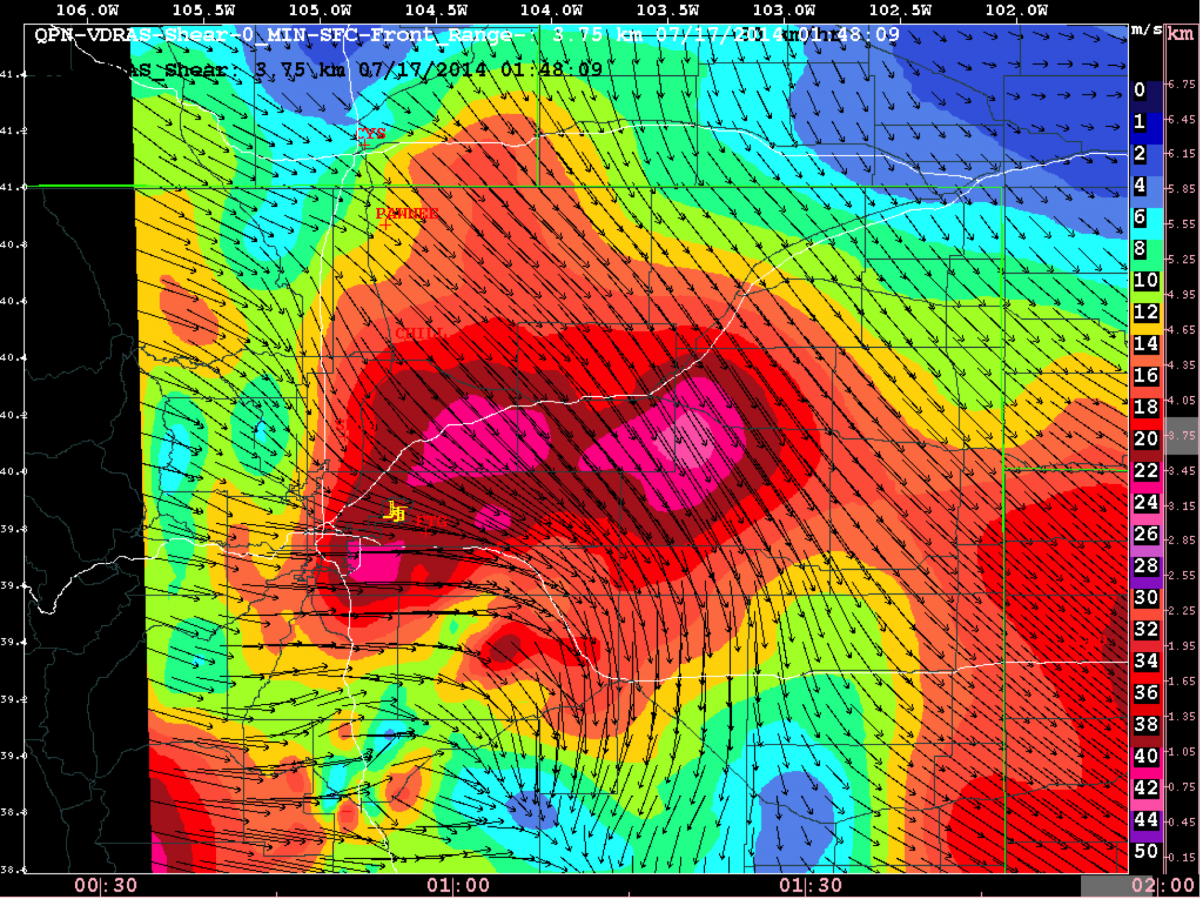
- high resolution winds and buoyancy analyses from VDRAS,
- streamflow prediction on a spatially-continuous high resolution grid, from the WRF-Hydro coupled atmosphere and hydrology model.
New Enhancements for 2017
QPE
- Continued improvement in the use of polarimetric weather radar for quantitative estimates of precipitation will be tested.
- Continued ingest of both the NCAR EOL Hybrid QPE and the operational MRMS QPE data stream into the STEP-Hydromet system will be done in real-time.
QPN
- New procedures will be tested for improving the 0-1 nowcasts of precipitation amount in the ANC/Trident systems.
- Procedures will be tested for automating the detection of near surface convergence lines; this is a necessity for significant breakthrough in convective storm and heavy rainfall nowcasting.
VDRAS
- Includes an improved surface data assimilation scheme.
- A quality control feature has been added to eliminate the influence of bad surface station data assimilated into VDRAS.
- VDRAS now produces a confidence field, ranging from 0-1, that can be used to minimize the contribution of VDRAS winds, convergence and buoyancy within the ANC/Trident nowcast systems in low confidence regions.
QPF
- WRF 3DVar with and without radar data assimilation (RA) will run on Cheyenne supercomputer.
- WRF 3DVar with and without RA will run with a GFS constraint to minimize bias increases observed in the models over time.
- The GFS model will be pulled in as climatology information for WRF 3DVar w/o RA and be active in every update cycle of the WRF 3DVar.
- The update cycle frequency will be 1h for WRF 3DVar w/ RA but the forecasts will all be with the 3h update cycle.
- A WRF 3DVar using Thompson multi-variable graupel scheme with and without RA will be run and compared with the baselines of single variable scheme.
- Morrison Milbrandt P3 microphysics scheme with and without RA will be run and compared with the Thompson multi-variable graupel scheme.
WRF-Hydro
- The WRF-Hydro (an instance of the National Water Model v1.2) will run over the STEP domain ingesting EOL QPE, Trident nowcasts, and WRF 3DVar forecasts w/ and w/o RA.
- The WRF-Hydro outputs can be compared to the National Water Model being run over the CONUS that is driven by the MRMS QPE and uses the HRRR forecasts.
- Improvements to the WRF-Hydro system running this summer include calibration of several basins in the domain and generalizing the results to the remaining basins in Front Range
- v1.2 of the National Water Model also includes numerous updates to the underlying digital elevation model (DEM) which better harmonizes the model terrain with the NHDPlus stream channel vector network, thus allowing for improved overland flow inundation mapping.
- Streamflow measurements will be collected and assimilated into the WRF-Hydro in real-time
- Nudging assimilation of observed flows into channel network (no spatial and minimal temporal smoothing)
- Forecast-phase bias correction alleviates drift to open loop away from the observations
- An improved WRF-Hydro interactive web page (HydroInspector) is available to view streamflow prediction plots.
STEP-Wide Concurrent Activities
- NCAR/MMM Ensemble forecasts (see link) are running through the summer, with an update cycle of once per day.
- The WRF 3D-Var ensemble (10 members) will be tested during July 2017, with different backgrounds and different microphysical schemes used in the ensemble. This includes Thompson multi-variable graupel scheme and the Morrison Milbrandt P3 microphysics scheme with and without RA.
- New within the Thompson microphysics package is an aerosol aware microphysics scheme and a variable density graupel scheme that allows for variable fallspeeds and diagnosis of mid-size graupel/hail.
- A hail comparison option is available through the NCAR ensemble forecasts link, comparing Thompson diagnostic, hailcast, and a machine learning version provided by D. Gagne. Graphics are accessible from the 'Hourly-Max' menu, sub-menu 'Hourly-max Vert. Int. Graupel & Hail Size'. This will be available through the summer. Note, that this is based on the Thompson in v3.6.1 of WRF, not aerosol aware.
- A separate run of WRF-Hydro is being planned that will run either with the Thompson or Morrison scheme.
For description of the individual components of the Hydromet Prediction System and explanation of real-time plots, click on the above QPE, QPF, QPN, Streamflow and Verification tabs
To view real-time observations, QPN and QPF forecasts, hydrologic streamflow predictions, and near real-time verification, click on the appropriate link under STEP Hydromet Experiment Links
To view a current set of images from the Hydromet Prediction System, click on Current Images.
Background
There have been increasing demands for accurate hydrological prediction, as urban flooding resulting from heavy rainfall and other high-impact weather has resulted in significant societal and economical costs. Thanks to the improved observation networks, advancement of computer technology, and scientific and technological development of data assimilation, the past decade has seen improvement in quantitative precipitation forecasts (QPF) and streamflow predictions. The ultimate improvement in rainfall and streamflow prediction that can truly benefit society requires a fully coupled (or end-to-end) system that consists of high-resolution observations, state-of-the-art data assimilation and QPF systems, high-resolution, location-specific nowcasts and advanced hydrological modeling.
NCAR’s cross-laboratory science program STEP (Short Term Explicit Prediction) was established in 2005 with the goal to advance the science and application of short-term prediction of high impact weather. STEP scientists have developed various state-of-the-art systems to tackle the challenging problem of accurate prediction of high impact weather, including an automated nowcasting system, rapid cycle radar data assimilation QPF systems, object-based verification systems, and a streamflow prediction system that is coupled with the Weather Research and Forecast (WRF) model. Recognizing the societal need for a coupled system that takes advantage of the state-of-the-art meteorological and hydrological prediction systems, STEP began an effort in 2013 to develop an end-to-end hydrometeorological heavy rainfall and streamflow prediction system. This integrated system was first tested and demonstrated in the summers of 2014-2016 over the Rocky Mountain Front Range region and is being run again during the summer of 2017.

Experiment Location and Domain
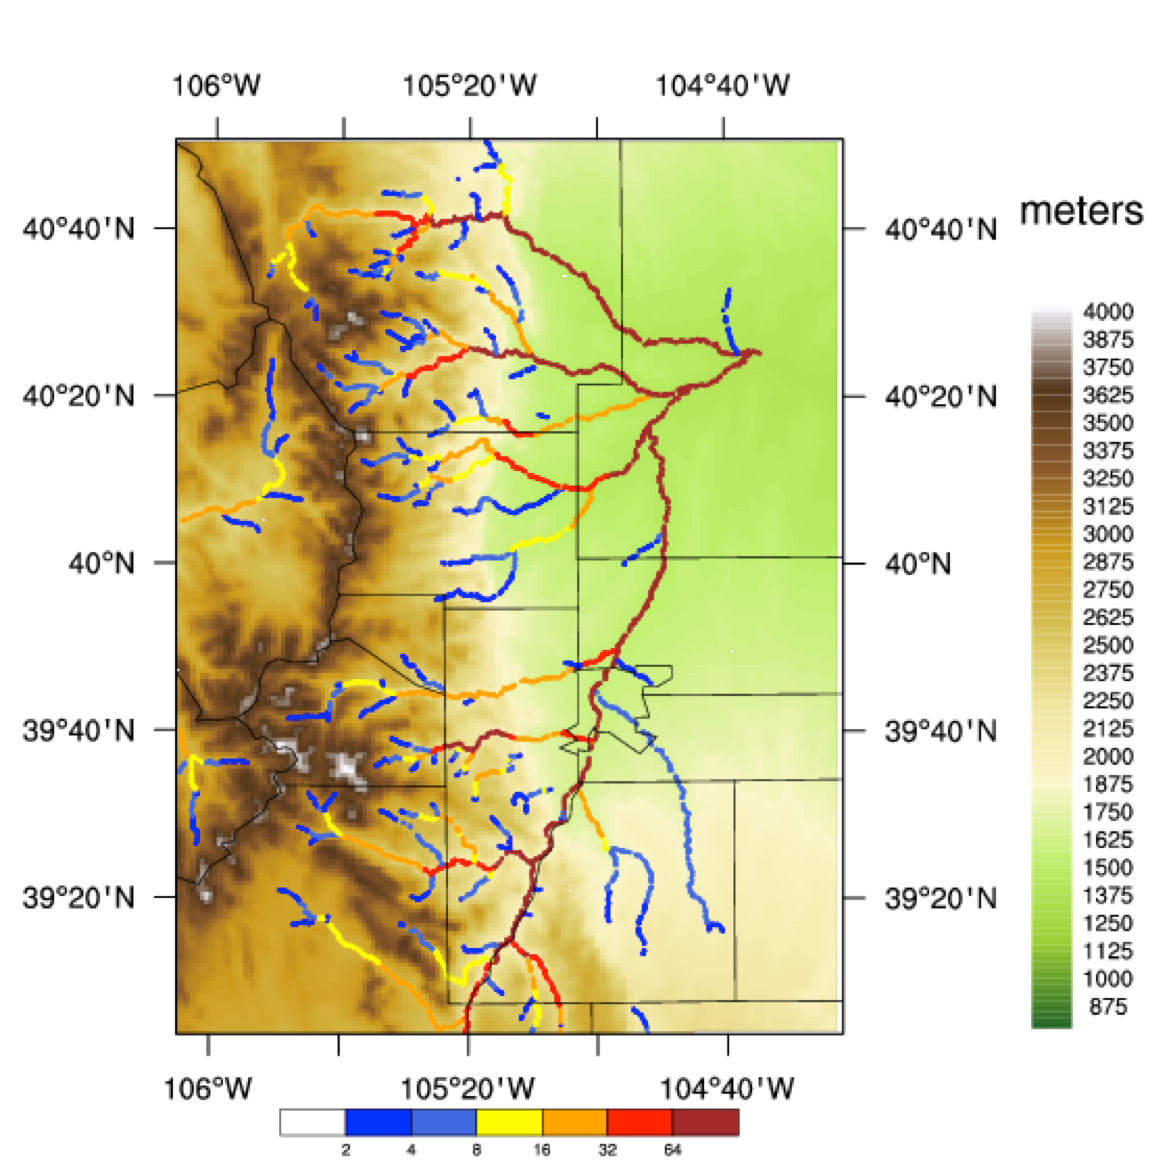
The STEP Hydromet experiment will be conducted in the region of the Rocky Mountain Front Range. This region was chosen because of its high frequency in flash flood occurrence, the existence of an advanced mesoscale observation network, and its social and economic vitality. In addition to several operational NEXRAD radars and dense surface stations, the mesoscale observation network FRONT (Front Range Observation Network Testbed) also includes two S-band polarimetric research radars, the NCAR S-pol and Colorado State University CHILL.
Figure 1 shows the locations of these radars relative to the operational Denver KFTG radar and relative to the Colorado Front Range terrain. The radar data assimilation and WRF NWP systems will be run on three domains with a 15km/3km/1km nested grid. The WRF 3D-Var 3 km domain with radar data assimilation is shown in the left-hand panel. The hydrological and nowcasting systems will be run over the innermost 1 km domain, shown in the right-hand panel and the radar data assimilation will be conducted over the 3 km middle domain.
The STEP Hydromet Prediction System is composed of the following components:
- Quantitative Precipitation Estimates (QPE)
- Quantitative Precipitation Forecast (QPF)
- Quantitative Precipitation Nowcasting (QPN)
- Streamflow
- Verification

QPE
Timely and accurate Quantitative Precipitation Estimates (QPE) are essential for forecasting stream flow particularly for flash floods and localized urban flooding.
Radar and rain gauge-based QPE are being used in this prediction system for determining:
- How hard it is raining
- How much rain has fallen in the intermediate past
QPE fields are being used in this prediction system:
- As input for quantitative precipitation nowcasting algorithms (Autonowcaster and Trident system)
- As input to the hydrology model (WRF-Hydro)
- For evaluation of radar-based QPE compared to rain gauge measurements of precipitation
- For verification of NWP precipitation forecasts
A variety of QPE techniques are being tested. Details of these techniques can be found at: Radar_QPE_processing.pdf
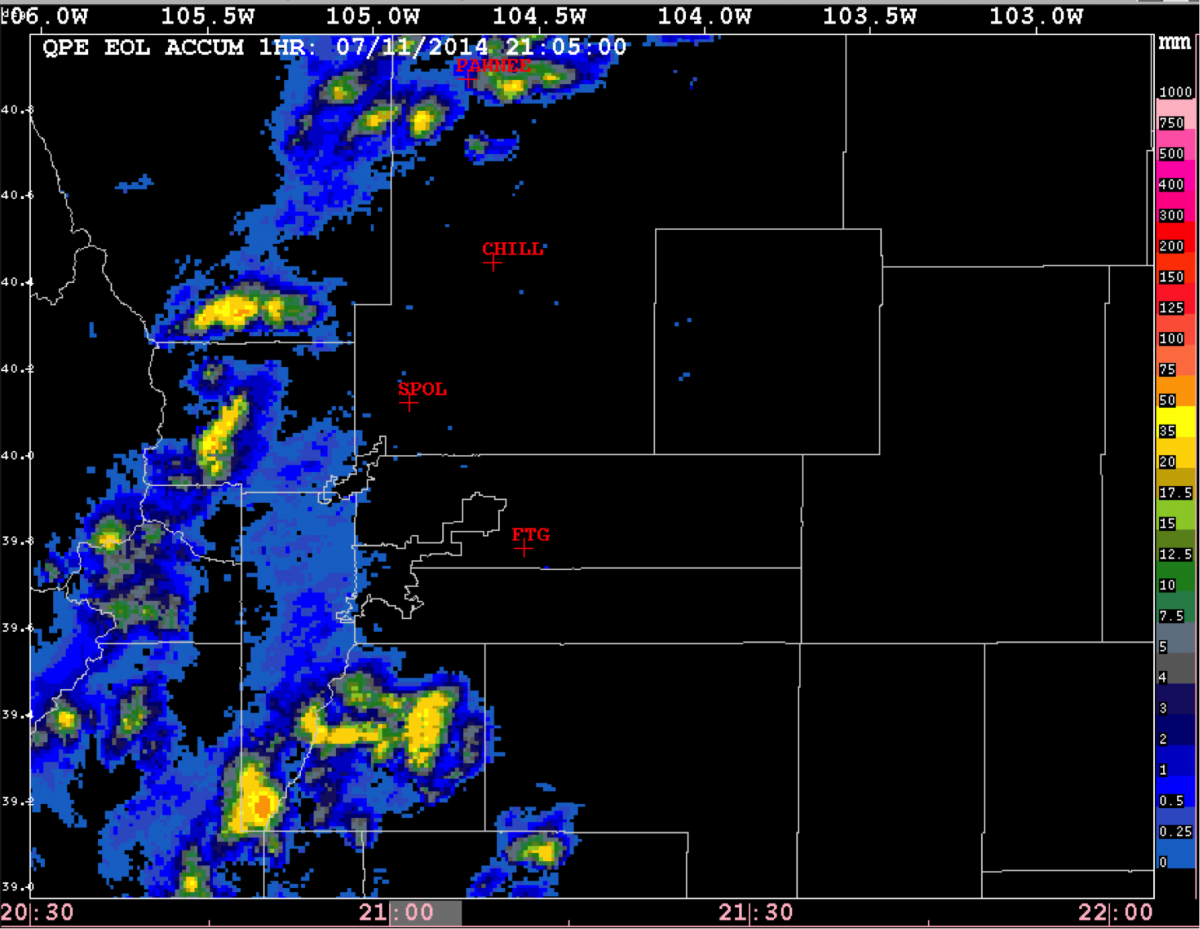
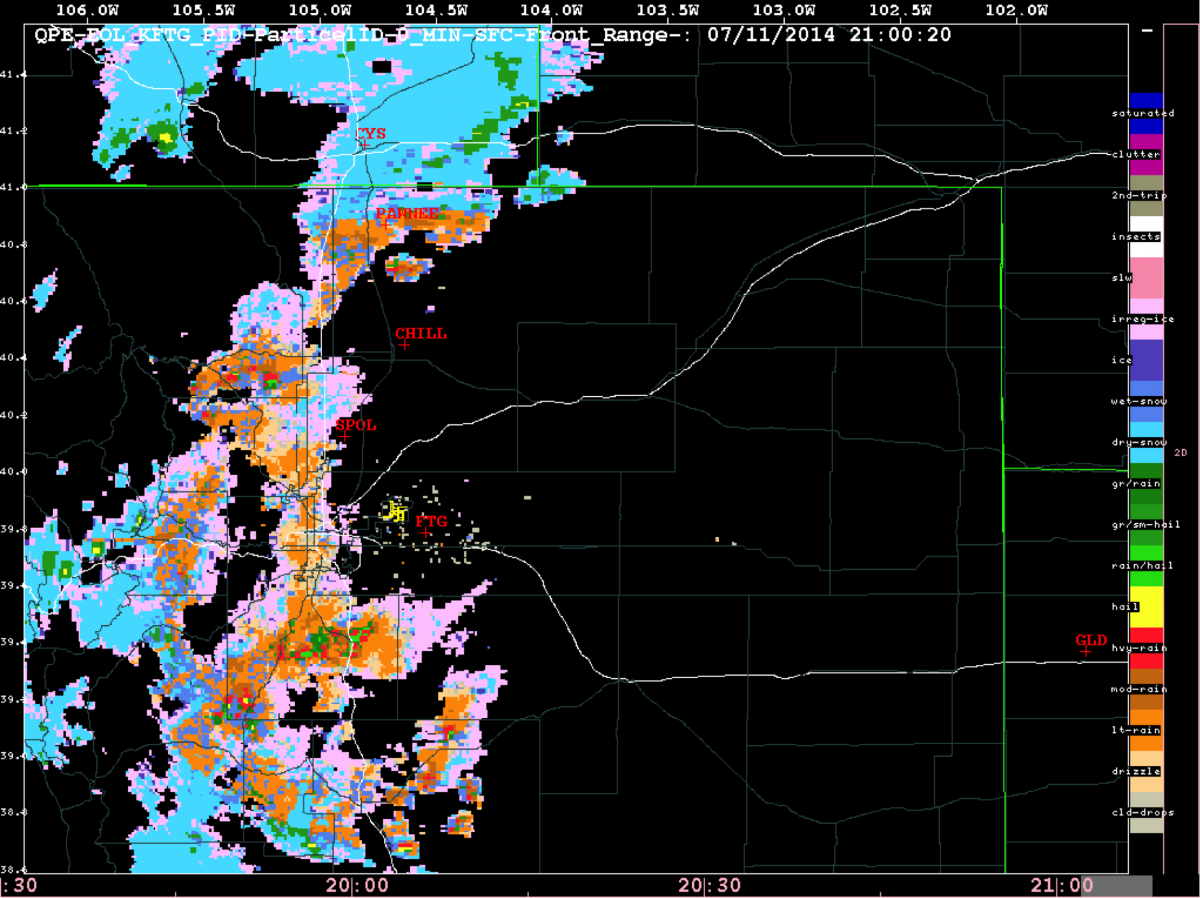
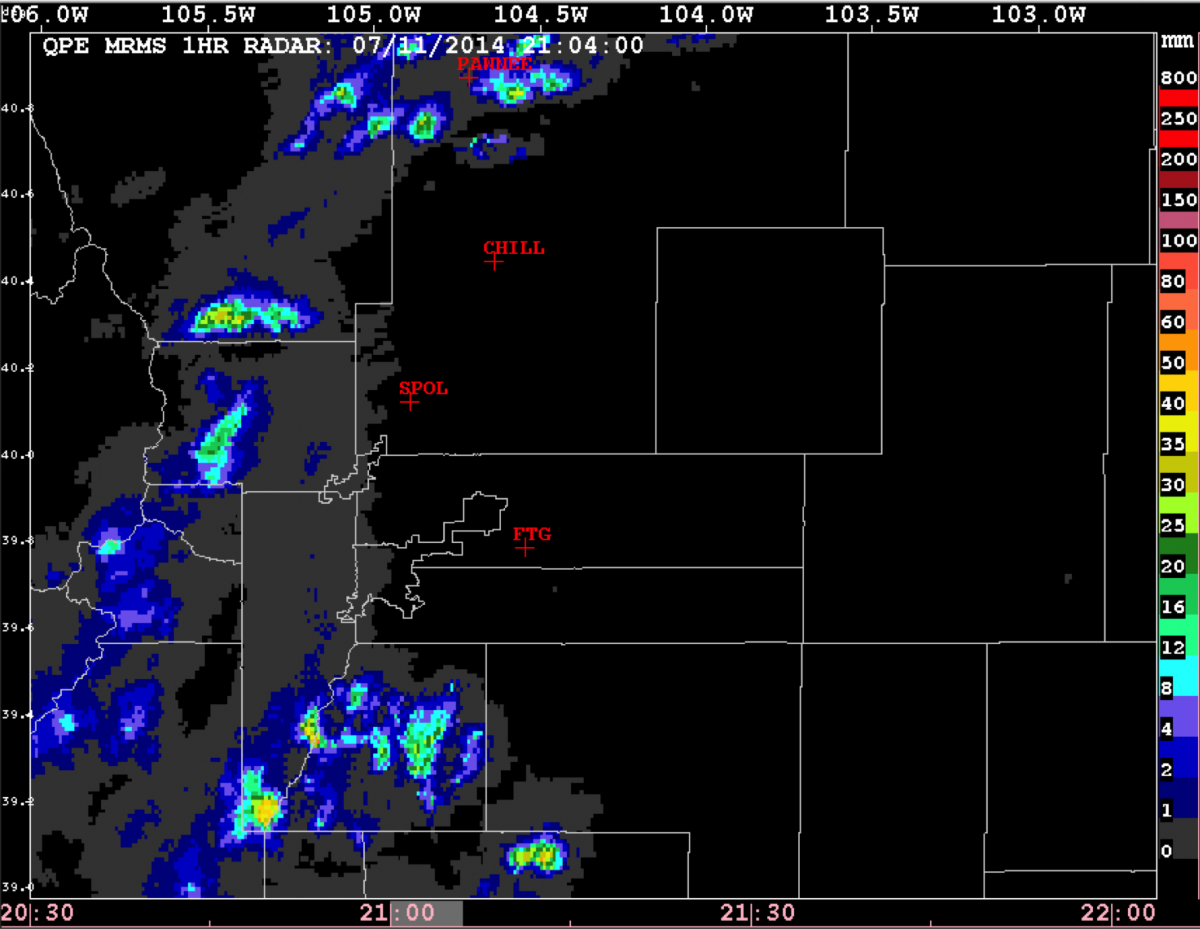
The EOL-QPE field displayed here is the 1 hour rainfall accumulation (in mm). It is a mosaic of QPE values from the three NEXRAD radars (Denver, Cheyenne, and Pueblo). It is computed using polarimetric radar variables to first determine the type of precipitation (snow, rain, hail) using the EOL Particle Identification algorithm (PID) and then apply a specific algorithm to convert the radar variables for each precipitation type to precipitation rate and accumulation.
The NSSL Multi-radar/multi-sensor system (MRMS) QPE field is produced from multiple radars, surface and upper air observations, lightning detection systems, satellite and forecast model output. The MRMS QPE field being displayed here is the 1 hour precipitation accumulation (not gauge corrected) field (in mm). This product updates once per hour.
Rain gauge 6 hour rainfall accumulations (in mm) are shown for two rain gauge networks along the Front Range: the ALERT and CoAgMet networks. A 24 hour rainfall accumulation plot for the day valid at 00 UTC each day is produced at 5 am the next morning.
QPF
Quantitative Precipitation Forecast (QPF) is a critical input for hydrological models in order to produce accurate stream flow prediction. Current operational NWP models are useful in providing guidance for precipitation forecast, but not adequate in providing QPF with timing and location precision that is required by the hydrological models. One of the key aspects in improving the accuracy of short-term QPF is to initialize the NWP models with high density and high frequency data. Through NCAR’s STEP program, data assimilation systems are developed that have the capability to assimilate conventional as well as radar observations. The STEP Hydromet System in 2015 will run WRFDA 3D-Var, a 3-dimensional variational data assimilation system assimilating conventional observations and radar radial velocity and reflectivity data, with 1-3 hourly rapid update cycles.
During the STEP Hydromet Experiment, WRFDA 3D-Var is used to initialize WRF for 0-12h QPF on a 15km/3km nested domain centered at the Front Range region. The QPF products are employed to initialize WRF-Hydro for flash flood prediction. In additional to running WRF 3D-Var with and without radar data assimilation, a baseline WRF will be run to provide a benchmark for the radar data assimilation system.
To view 0-12h WRF forecasts
QPN
The term nowcasting in Quantitative Precipitation Nowcasting (QPN) is used to emphasize that forecasts are for the very short term period; in this Hydromet Prediction System, the nowcasts are for 0-1 hour in the future and provide explicit prediction of precipitation in space and time. Longer period precipitation forecasts (QPF) currently have insufficient skill in accurately predicting heavy rainfall on the temporal and spatial scales needed for streamflow prediction (100 m resolution) and on the scales at which flash floods occur (a few kilometers). The rapid update frequency and specificity of short-term precipitation nowcasts have higher skill than current NWP forecasts. Thus, QPN is an important component of the Hydromet Prediction system for improving flash flood prediction and for inclusion in the WRF-Hydro model to increase the accuracy of streamflow prediction.
The nowcasts displayed here are produced by the AutoNowcaster, Trident, and VDRAS systems.
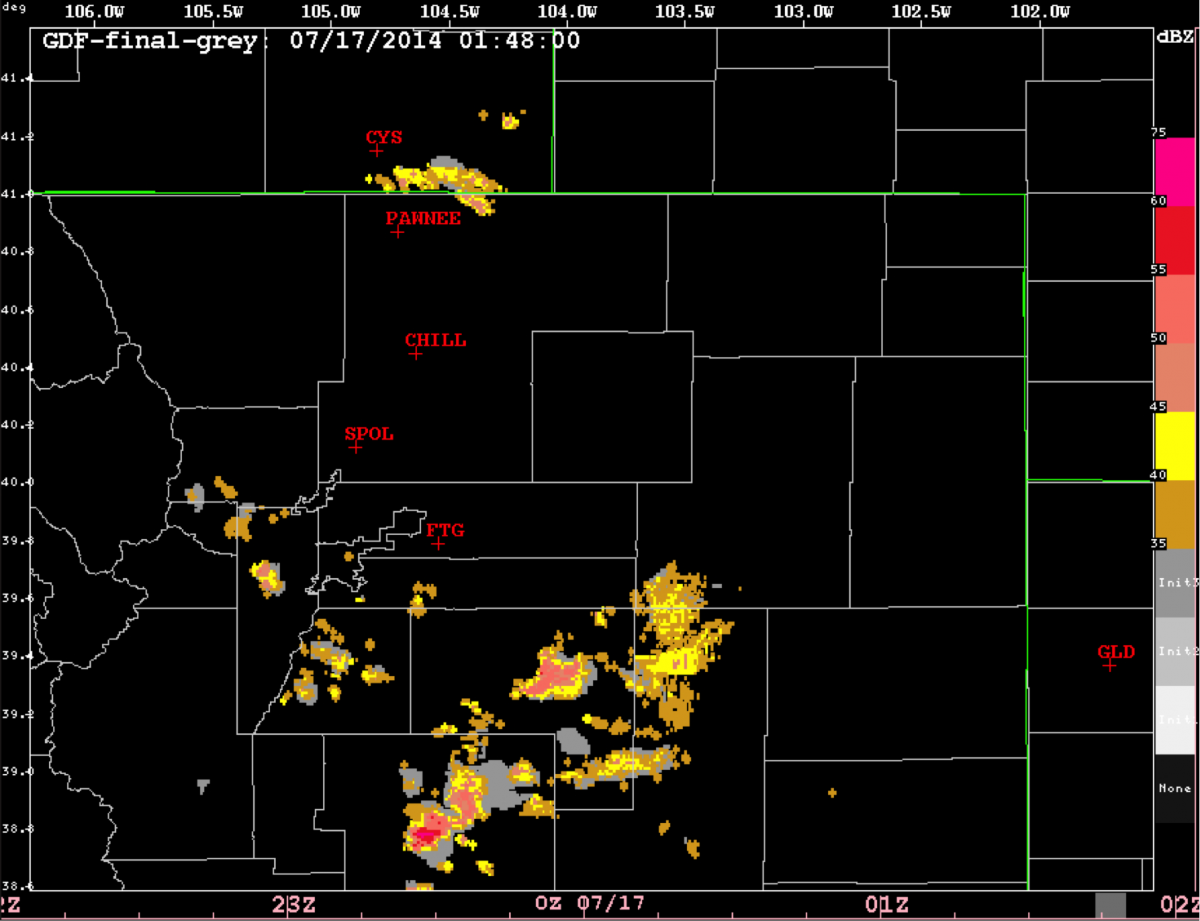
The Autonowcaster (ANC) combines radar, satellite, sounding, surface station data and high-resolution 4-D boundary layer winds (VDRAS) to nowcast the location and time of storm initiation (Storm Init field), growth and decay (Gandi field, in units of radar reflectivity) 0-60 min in the future.
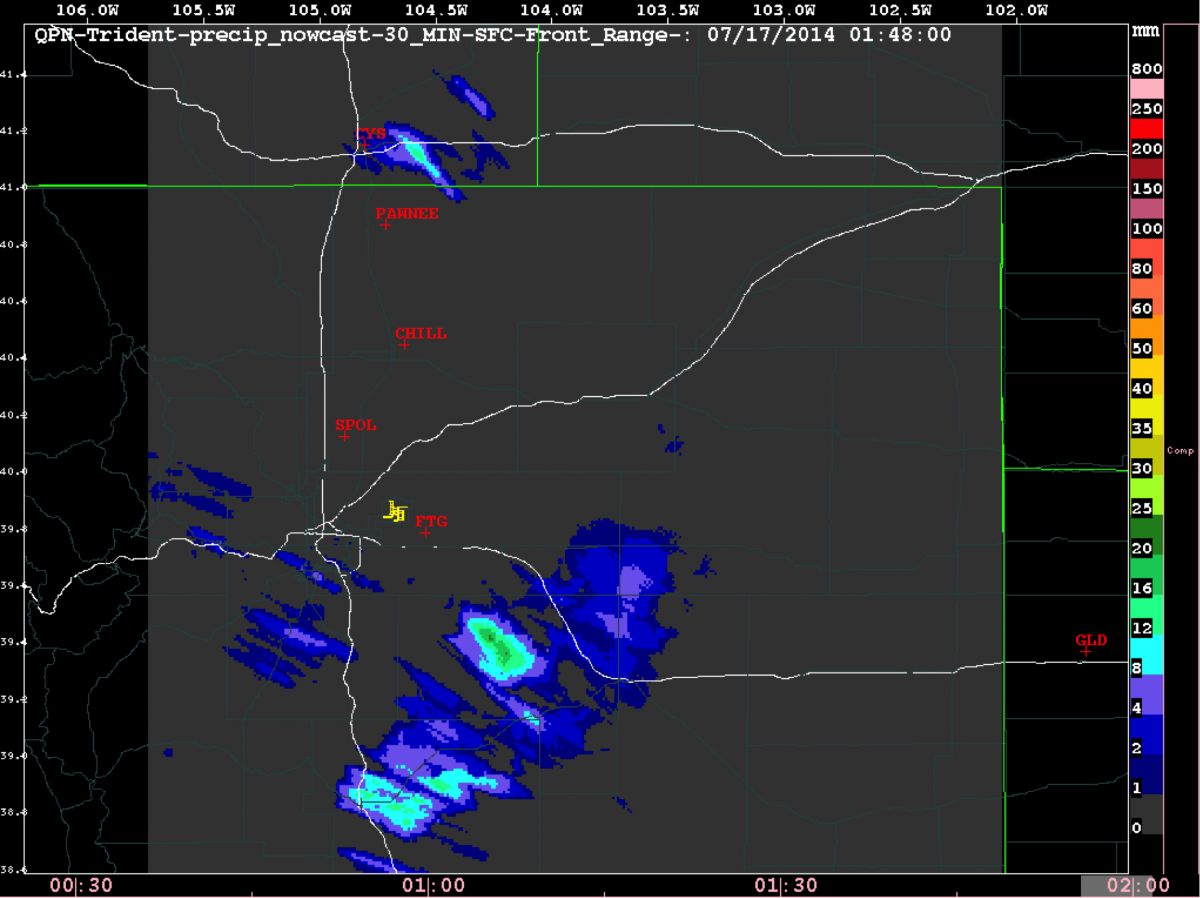
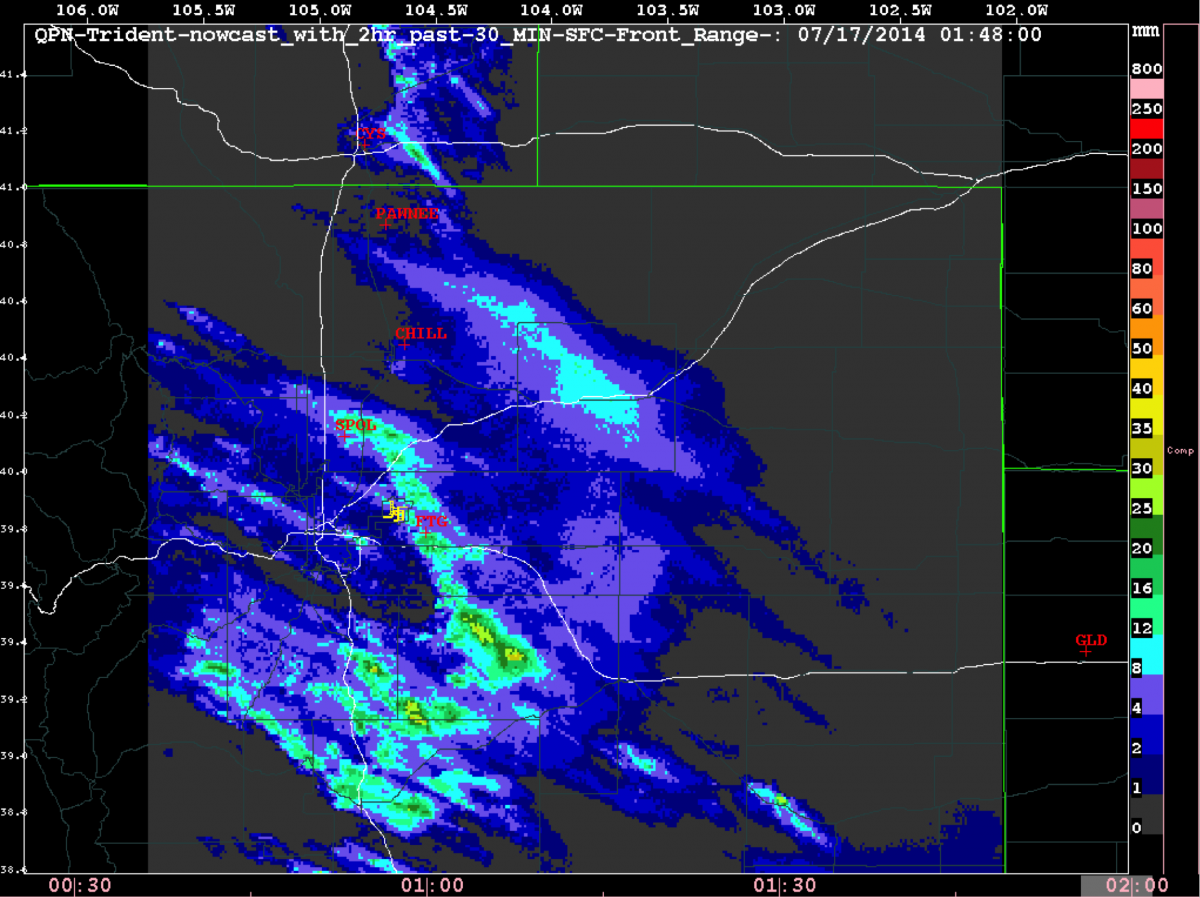
Trident converts the AutoNowcaster reflectivity nowcasts to 1 hour rainfall accumulation nowcasts (Precip nowcast field) that are input to the Hydrology model (WRF-Hydro). Trident also produces fields that include a 1 hour rainfall accumulation nowcast plus the past 2 hour rainfall accumulation (Nowcast-with-2hr-past field) using data from the EOL QPE algorithm, and a color-coded warning guidance product.
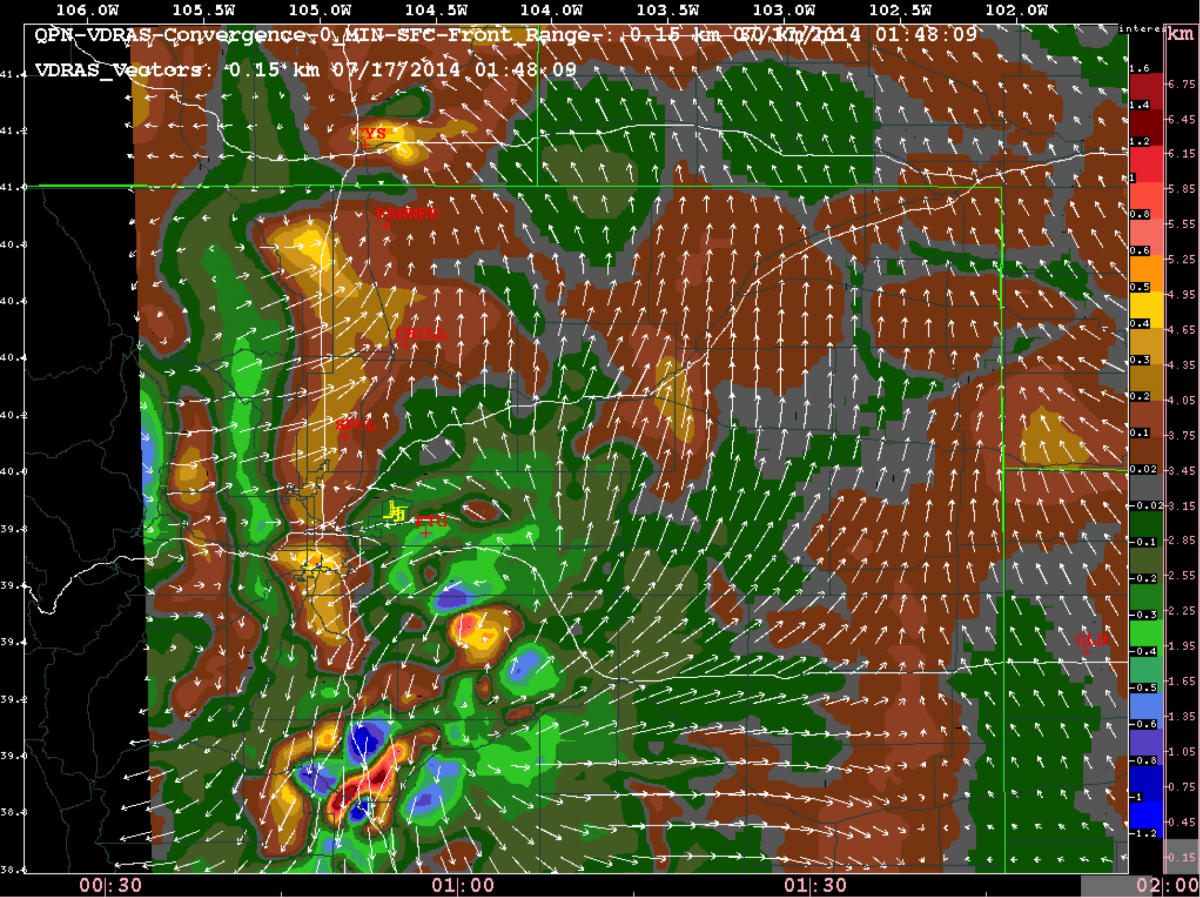
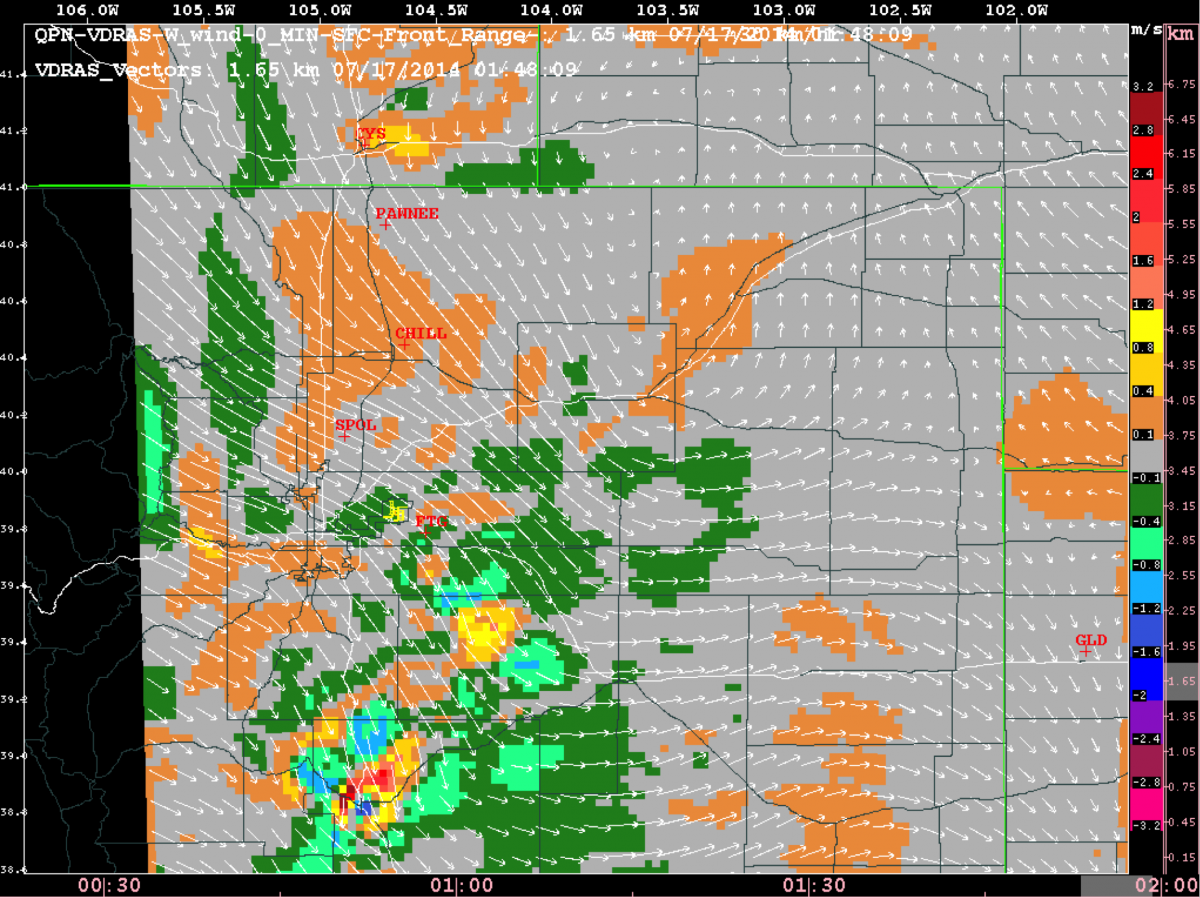
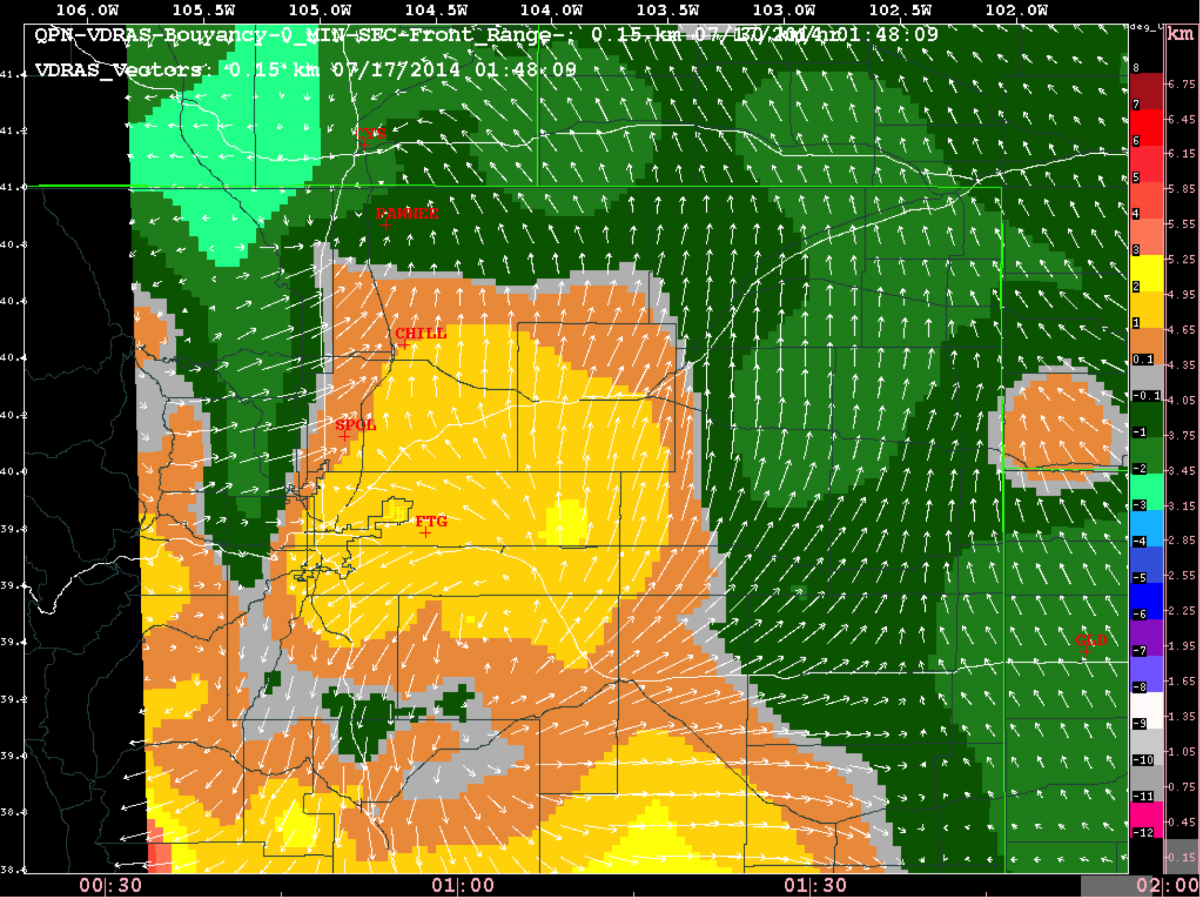
The Variational Doppler Radar Analysis System (VDRAS)assimilates high density and frequency observations from the NEXRAD radars into a convection-permitting model to produce high-resolution analyses of the 4-D winds and other fields that include convergence, vertical velocity, buoyancy, vertical wind shear, CAPE and Relative Humidity.
The STEP Hydromet Prediction System is composed of the following components:
- Quantitative Precipitation Estimates (QPE)
- Quantitative Precipitation Forecast (QPF)
- Quantitative Precipitation Nowcasting (QPN)
- Streamflow
- Verification
Streamflow
Flood forecasts depend on knowledge of the state of atmospheric features that trigger heavy rain as well as the state of surface and subsurface water, including the heights of rivers and reservoirs and the amount of soil saturation. Although both meteorological and hydrological models have improved in detail and accuracy over recent years, they can be difficult to operate in a simultaneous and integrated (i.e., coupled) fashion. The hydrological extension of the Weather Research and Forecasting model (WRF-Hydro) is a community-based framework designed to link models of the atmosphere and terrestrial hydrology. The configuration of WRF-Hydro running in the STEP Hydromet Prediction System is ingests WRF-3DVar atmospheric model output with selected WRF-Hydro hydrology physics options to produce analyses and forecasts of water cycle processes and streamflow prediction over a range of spatial and temporal scales.
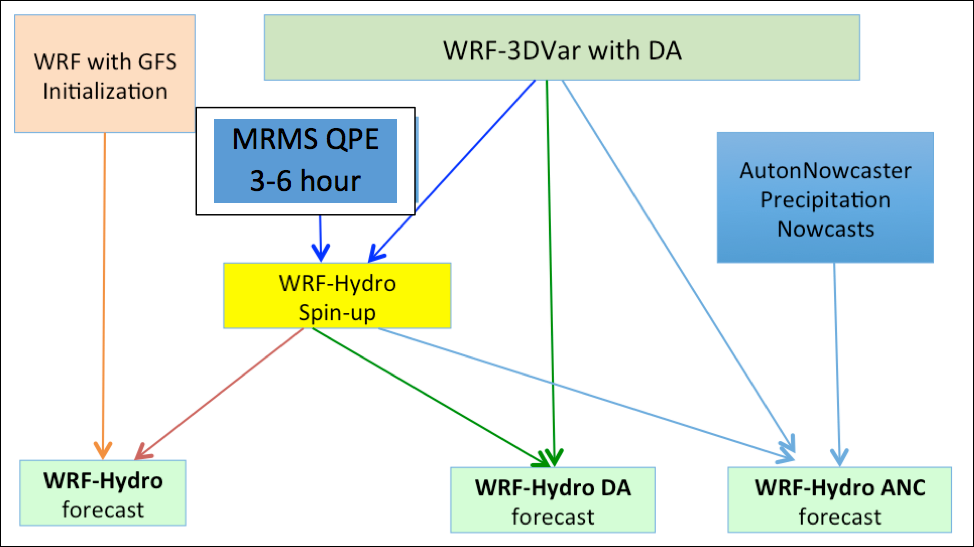
WRF-Hydro is being driven in three ways during the 2015 STEP Hydromet Experiment:
- Baseline WRF with GFS initialization (WRF-Hydro)
- WRF-3DVar with radar data assimilation (WRF-Hydro DA)
- WRF-3Dvar with radar data assimilation and AutoNowcaster/Trident (ANC) precipitation nowcasts (WRF-Hydro ANC)
The flowchart below shows the three instances of WRF-Hydro running on the Yellowstone supercomputer. The past 3 to 6 hr rainfall accumulation obtained from the MRMS radar-based QPE mosaic is used in the WRF-Hydro spin-up period.
WRF-Hydro produces 0-12 hr streamflow forecasts on a 100 m resolution grid centered over the Front Range. An example of the streamflow forecast product is shown below.
Verification
Timely verification of the Hydromet Rainfall Prediction System components can pinpoint strengths of the system, areas for improvement, and aid in interpretation of the forecasts. Verification statistics will be computed in near-realtime to evaluate the precipitation forecasts from the WRF-3DVar with radar data assimilation, the WRF-3DVar without radar data assimilation, and performance of the radar-based QPE compared to rain gauge precipitation measurements. Streamflow forecast evaluation will also be included in the system at a later time.
Appropriate evaluation methods answer a variety of relevant questions in areas such as:
Forecast Improvement
- What are the characteristics of the errors?
- For which scales do the forecasts have skill?
System Development
- What are the contributions of the individual components?
System Improvement and Optimization
- Are there particular types of weather situations in which the forecasting system works better or worse?
- Has the system improved and in what ways?
Management
- Has the system improved?
- How does the system perform relative to competing systems?
User Guidance
- For which scales and thresholds does the forecast have skill?
- Does the system perform better/worse in different weather situations?
The Model Evaluation Tools (MET) software package produces statistics based on the comparison of an input forecast (QPF, QPN, Streamflow) and an input verification data set (QPE, rain gauges, NSSL Multi-Radar/Multi-Sensor QPE product, stream gauges). For evaluation of the QPE, the QPE field is treated as a forecast and evaluated using rain gauge observations.
Example statistics and methods that can be used to answer the questions above include contingency table statistics and object-based approaches. These approaches are described below.
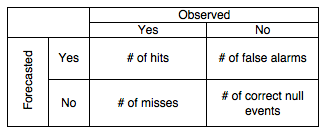
Contingency Statistics
A contingency table consists of a tabulation of hits, misses, and false alarms when comparing the forecast to the verification data set.
Example contingency table statistics based on this table include:
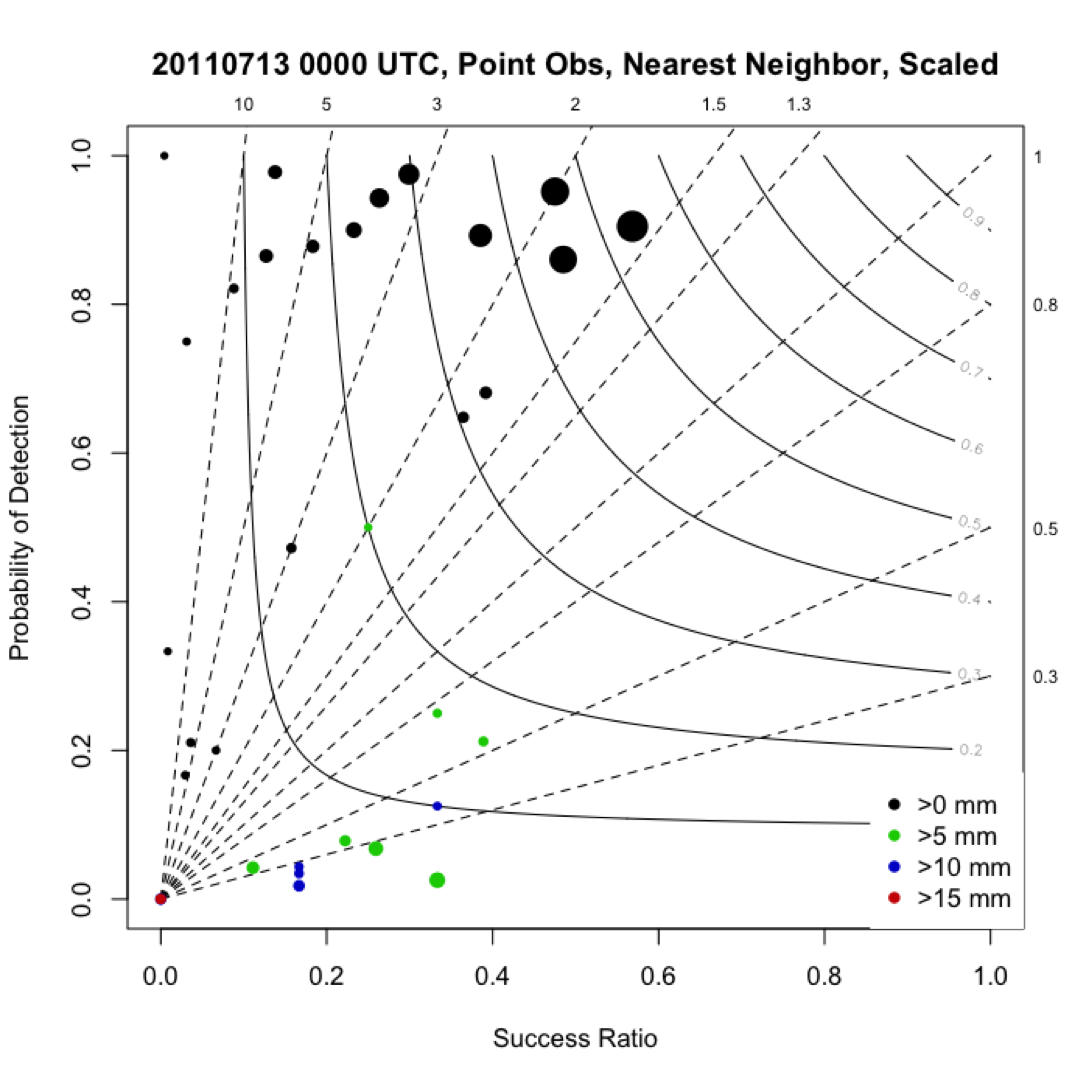
Probability of Detection (POD): Proportion of observed events that were successfully forecasted
POD = [Hits / (Hits + Misses)]
False Alarm Ratio (FAR): Proportion of forecasted events that were false alarms
FAR = [False Alarms / (Hits + False Alarms)]
Success Ratio (SR): SR = 1 - FAR
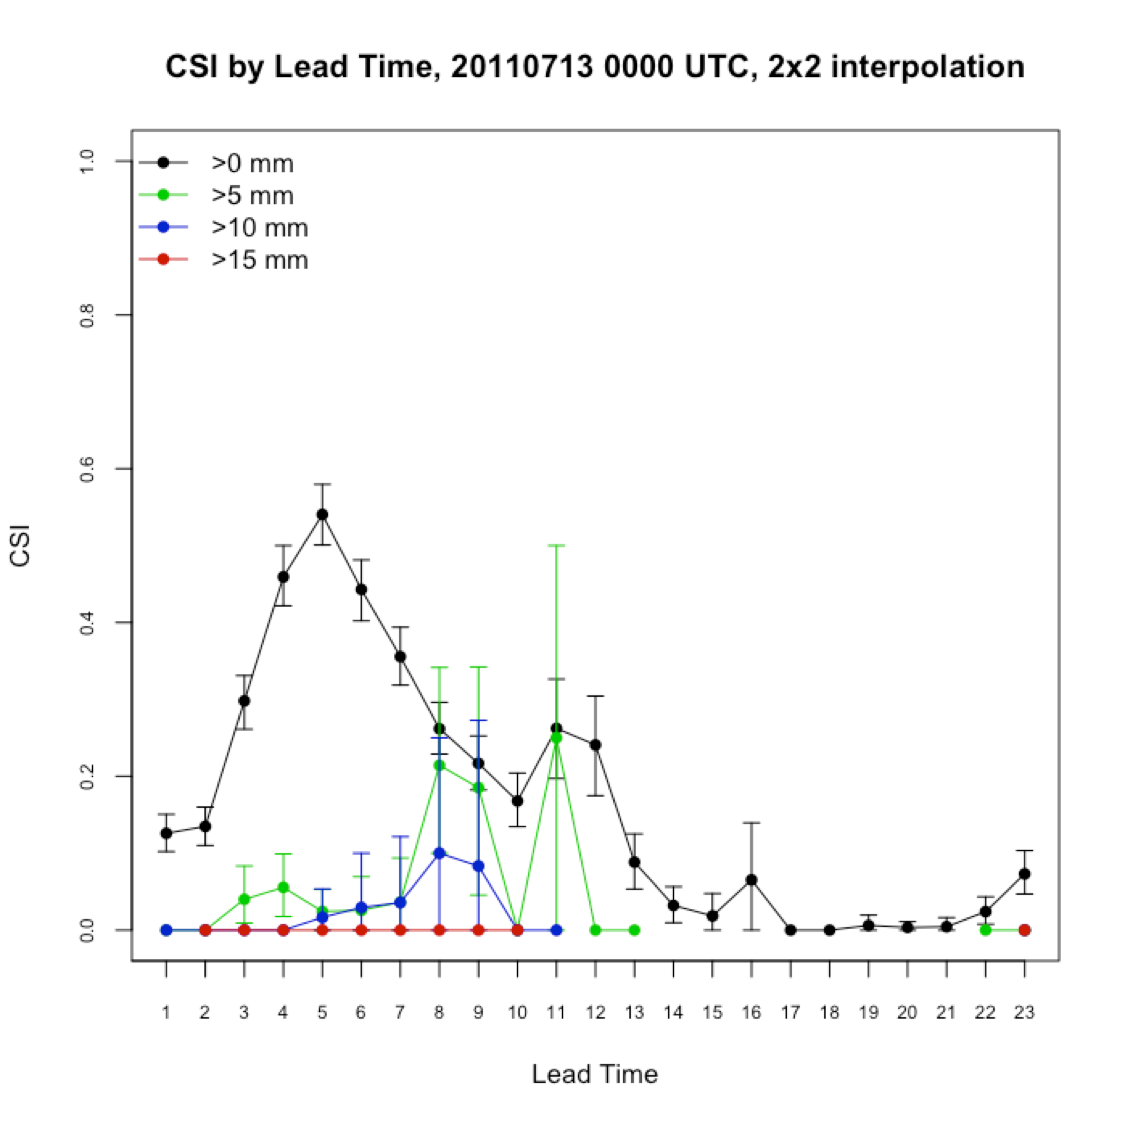
Critical Success Index (CSI): Ability of system to successfully predict an event relative to Hites, Misses, and False Alarms
CSI = [Hits / (Hits + Misses + False Alarms)]
Bias: Relative area coverage of the forecasted event compared to the area coverage of the observed event
Bias = [(Hits + False Alarms) / (Misses + Correct Nulls)]
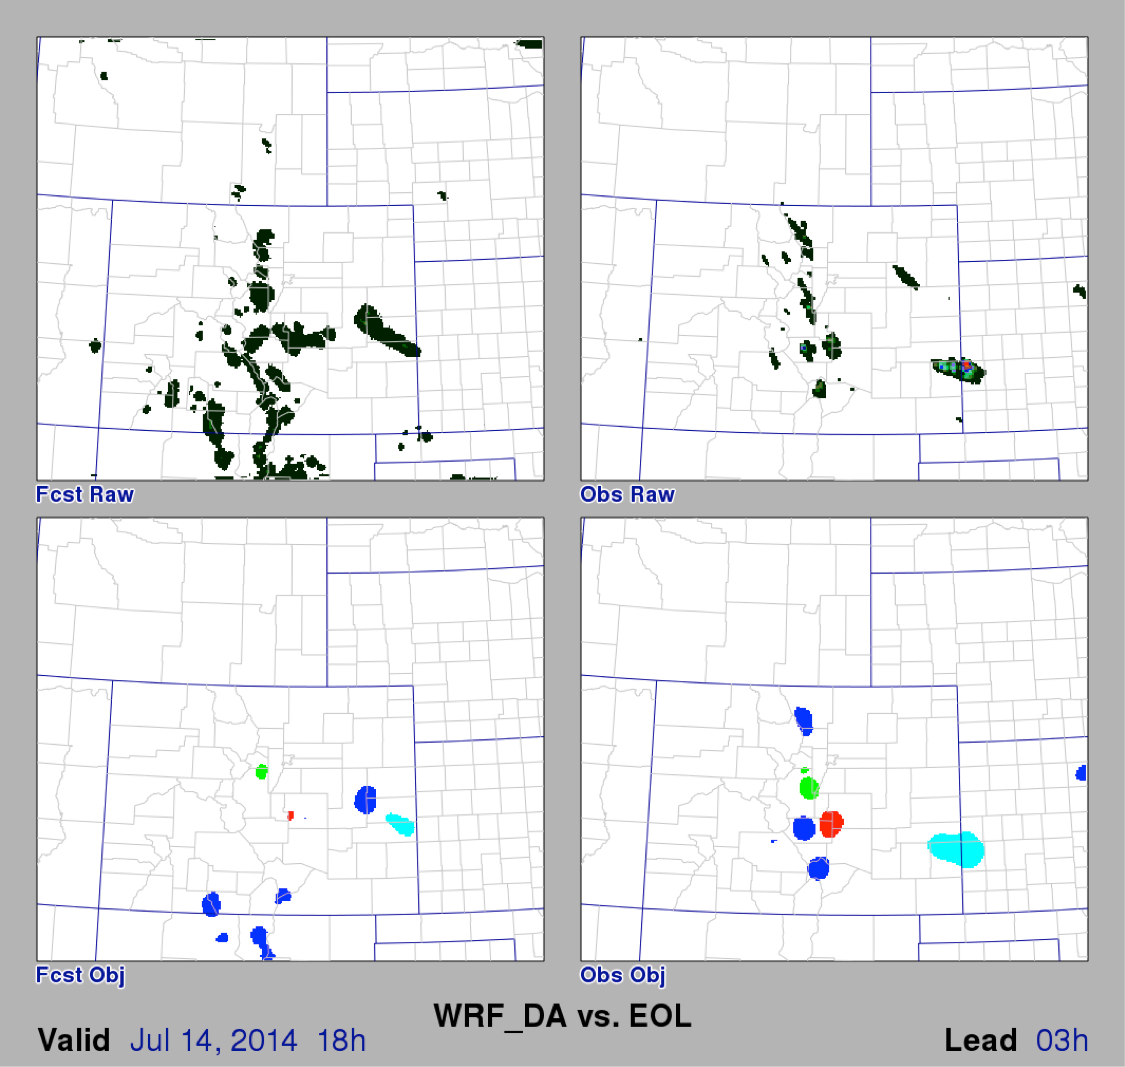
Object-Based
The Method for Object-Based Diagnostic Evaluation (MODE) tool provides an objective comparison of the overall structure of the forecasted precipitation with what was observed. Rather than evaluating hits and misses at a point/neighborhood as is done with the contingency table, object-based evaluation identifies precipitation objects and compares attributes of matched forecast and observed objects. The attributes considered include area coverage, centroid displacement, intensity, and overlap.
Short Term Explicit Prediction Program (STEP)
Jenny Sun
STEP Hydromet Prediction System 2015 Demonstration
Rita Roberts
Jenny Sun
Dan Megenhardt
Quantitative Precipitation Estimation
Kyoko Ikeda
Jim Wilson
Numerical Weather Prediction and Data Assimilation
Jenny Sun
Short-term Nowcasting (AutoNowcaster, Trident, TITAN)
Jim Wilson
Rita Roberts
Dan Megenhardt
WRF-hydro and Streamflow Prediction
David Gochis
Arezoo RafieeiNassab
Yongxin Zhang
QPE and Forecast Statistical Verification
Barbara Brown
Amanda Anderson
Randy Bullock