Turbulence Impact Mitigation Workshop 2
-
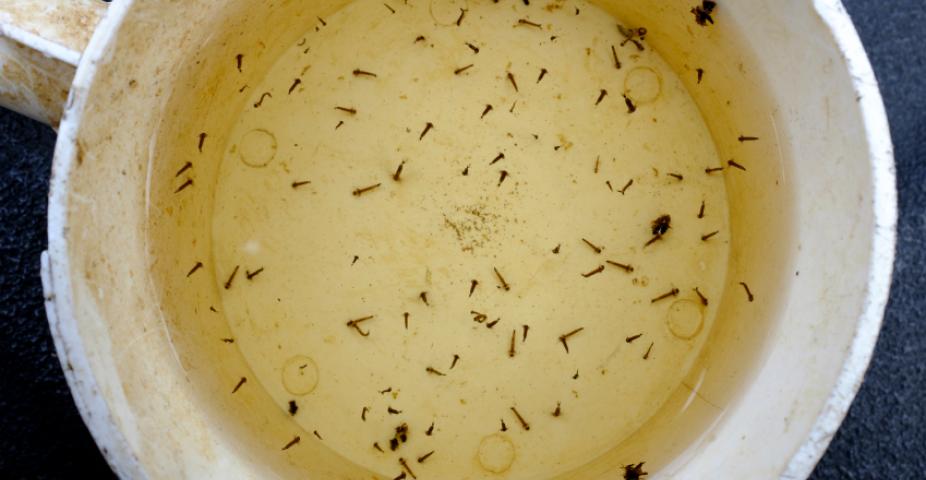
Modeling the population dynamics of dengue vector mosquito Aedes aegypti is often done using dynamic life cycle models that simulate the life cycles of cohorts of mosquitoes using a mechanistic approach.

Perhaps the greatest limitation of these dynamic life cycle models is the continued use of simplistic empirical relationships to predict water temperature in and water loss from containers based on several meteorological variables. In contrast, physics-based models solve for the energy balance of the water inside of the container, taking into account shortwave (solar) and longwave (terrestrial) radiation and heat fluxes (sensible, latent, and ground).
An energy balance container model developed by RAL scientists, termed the Water Height And Temperature in Container Habitats Energy Model (WHATCH'EM), solves for water temperature and height for user-specified containers with readily available weather data. Realistic estimation of water temperature and height from WHATCH'EM has potential to improve output from mosquito population models and aid in assessment of dengue risk.
Please direct questions/comments about this page to:
Director, Weather Intelligence and Security Program
Atmospheric releases of hazardous materials, either accidental or intentional, continue to pose a viable threat to both United States citizens, as well as troops abroad and at home. To counter this threat, RAL is actively supporting research and the development of novel techniques and systems which can be used to more accurately simulate the atmospheric state and evolution of the released material in both time and space, for planning, real-time response, and forensic purposes.

In addition to needing a representative description of the atmospheric state (past, present, and future), Atmospheric Transport and Dispersion (AT&D) modeling systems also require precise specifications of the material release characteristics (e.g. location, time, quantity). For most real-time response scenarios, the specifics of the material release will be unknown, with only ancillary concentration sensor measurements available.
Algorithms and techniques to characterize the source and material are actively being developed at RAL to quickly reconstruct and estimate the source release using these limited sensor observations. In particular, RAL is actively developing a tailored Source Term Estimation (STE) and hazard refinement system, called the Variational Iterative Refinement STE Algorithm (VIRSA). VIRSA is a combination of models that include: the Second-order Closure Integrated PUFF model (SCIPUFF), its corresponding STE model, a hybrid Lagrangian-Eulerian Plume Model (LEPM), its formal numerical adjoint, and the software infrastructure necessary to link them (Fig. 1). SCIPUFF and its internal STE model are used to calculate a “first guess” source estimate based on available hazardous material sensor observations and meteorological observations. The LEPM and corresponding adjoint are then used to iteratively refine the "first guess" source and wind estimate using variational minimization techniques.

Version 1.0 of this system was successfully integrated into the US Department of Defense (DoD) emergency response modeling systems—HPAC (Hazard Prediction and Assessment Capability) and JEM (Joint Effects Model) in FY2012 (Fig. 2 illustrates an example of the graphical interface). This version of VIRSA includes the capability to refine the "first guess" source location, mass, and release time utilizing material sensor observations and meteorological observations. A stand-alone version that refines the first guess using the LEPM and its formal numerical adjoint was delivered to DTRA in FY2014.
Specific accomplishments and plans for next fiscal year are summarized below.
Verified and validated VIRSA with FUsing Sensor Information from Observing Networks (FUSION) Field Trial 2007 (FFT-07) campaign.

We have developed a software tool, the SOM-Assisted Hazard Area Risk Analysis (SAHARA), to reduce large climate datasets to more manageable sizes - yet statistically similar - which are then used to produce ensembles of potential hazard outcomes.The Self-Organizing Map (SOM) is a machine learning / data clustering algorithm which is well-suited for data that have strong topological properties. By employing the SOM algorithm to analyze topological patterns of climatological fields over a regional domain for a 30 year span, we can find a close statistical equivalent with fewer, non-contiguous input days. When using SOMs to cluster monthly climate data in this way, we find that by sampling only 150 days, it reduces computational time by greater than a factor of 6 compared to using the entire climate dataset. (See Figure 1)


The SAHARA software can scale from a laptop to workstations to many-core, many-node clusters by using a modern microservice architecture to distribute the Climate Database (CSFR currently), the SOM Engine, atmospheric model ensembles (such as the SCIPUFF Transport and Dispersion model) and pre- and post-processing across available computing resources, either locally or remotely. (See Figure 2)
We are currently in the process of adding the Weather Research and Forecasting (WRF) model as an additional workflow component to provide on-demand dynamical downscaling to increase the fidelity of simulations with high spatial and temporal resolution requirements, such as Urban-scale events.
Additional planned features and capabilities include:
DTRA