SIP Coordination Meeting
-
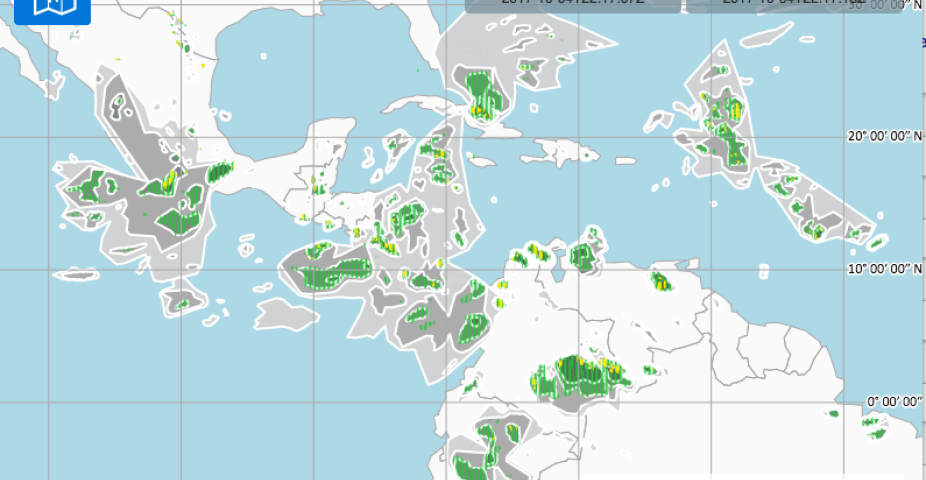
The Remote Oceanic Meteorology Information Operational (ROMIO) Demonstration is a project sponsored by the FAA’s Weather Technology in the Cockpit (WTIC) program. It is focused on analyzing oceanic aviation inefficiencies in current or future NextGen operations caused by gaps in either the available meteorological information or in the technology utilized in the cockpit. Using an operational demonstration to uplink convective weather products into the cockpit of domestic airlines, this effort helps to identify and analyze operational gaps.
In 2018, the WTIC ROMIO team began the operational demonstration with Delta Air Lines, United Airlines, and American Airlines. Following the ROMIO Operational Plan, all aspects of the demonstrations were carefully planned and included the availability and ingest of meteorological data sets, the creation of weather products, their dissemination to the aircraft and their display.
The WRF Variational Data Assimilation (WRFDA) system is in the public domain and is freely available for community use. It is designed to be a flexible, state-of-the-art atmospheric data assimilation system that is portable and efficient on available parallel computing platforms. WRFDA is suitable for use in a broad range of applications, across scales ranging from kilometers for regional and mesoscale modeling to thousands of kilometers for global scale modeling.
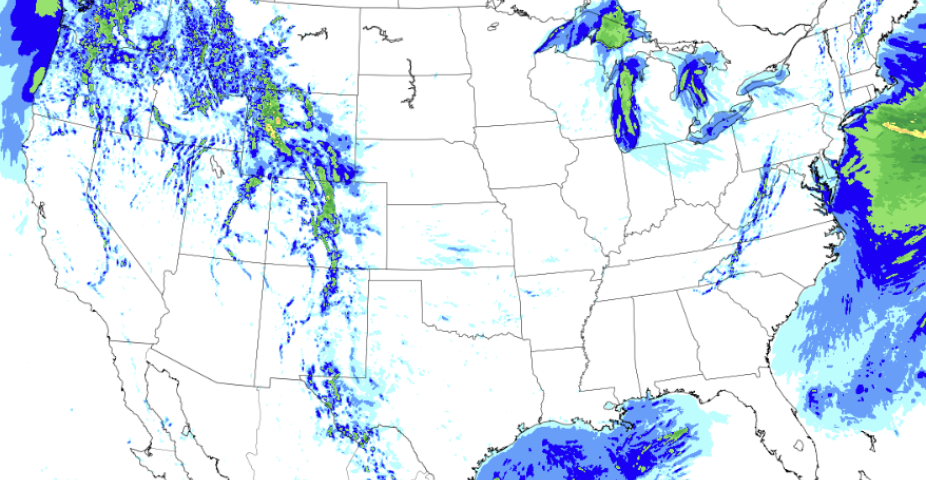
"NCAR Ensemble" produced a daily, 10-member, cloud permitting ensemble at 3-km grid spacing. Legacy links below.

This code is an implementation of a hybrid analog / regression multivariate downscaling procedure. The program reads a namelist file for the configuration information. The downscaling process is performed on a grid-cell by grid-cell basis and permits multiple approaches to downscaling. The standard hybrid analog-regression approach uses the input predictor variables to select a group of analog days (e.g. 300) from the training period for each day to be predicted. These analog days are then used to compute a multi-variable regression between the training data (e.g. wind, humidity, and stability) and the variable to be predicted (e.g. precipitation). The regression coefficients are then applied to the predictor variables to compute the expected downscaled value, and they are applied to the training data to compute the error in the regression. Optionally, a logistic regression can be used to compute (e.g.) the probability of precipitation occurrence on a given day, or the probability of exceeding any other threshold. Similarly, the logistic regression coefficients are applied to the predictors and output, or the analog exceedence probabilities can be output. Alternatively the code can compute the regressions over the entire time series supplied, a pure regression approach, or the analogs them selves can be used as the result, a pure analog approach. The pure analog approach can compute the mean of the selected analogs, it can randomly sample the analogs, or it can compute the weighted mean based on the distance from the current predictor.
The code requires both training and predictor data for the same variables as well as a variable to be predicted. The training and prediction data can include as many variables as desired (e.g. wind, humidity, precipitation, CAPE). All data must have geographic and time coordinate variables associated with them.
While this was developed for downscaling climate data, it is general purpose and could be applied to a wide variety of problems in which both analogs and regression make sense.
Development of the Gridded Meteorological Ensemble Tool (GMET) allows for quantification of uncertainty for station-based gridded precipitation and temperature datasets.

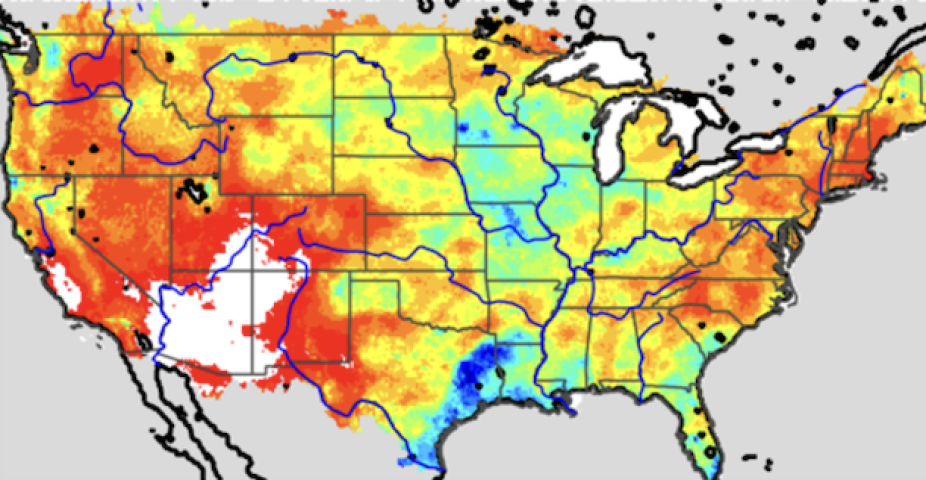
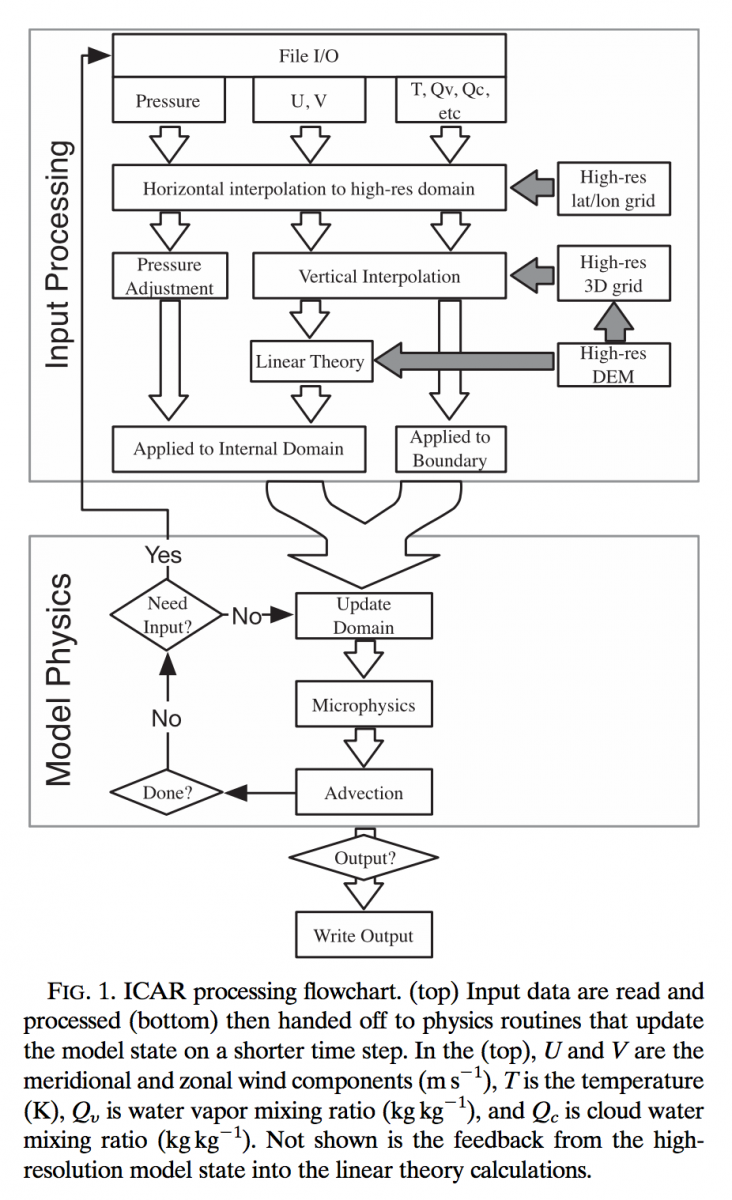
The Intermediate Complexity Atmospheric Research (ICAR) model is a simplified atmospheric model designed primarily for climate downscaling, atmospheric sensitivity tests, and hopefully educational uses. ICAR is a quasi-dynamical downscaling approach that uses simplified wind dynamics to perform high-resolution meteorological simulations 100 to 1000 times faster than a traditional atmospheric model and can therefore be used to better characterize uncertainty across numerical weather prediction models and climate models, and in dynamical downscaling.
Gutmann, E., I. Barstad, M.P. Clark, J. Arnold, and R. Rasmussen, 2016: The Intermediate Complexity Atmospheric Research Model. Journal of Hydrometeorology, 17, 957–973, doi:10.1175/JHM-D-15-0155.1
Gutmann, E., T. Pruitt, M.P. Clark, L. Brekke, J.R. Arnold, D.A. Raff, and R.M. Rasmussen, 2014: An intercomparison of statistical downscaling methods used for water resource assessments in the United States. Water Resources Research, 50, 7167–7186, doi:10.1002/2014WR015559
Gutmann, E.D., R.M. Rasmussen, C. Liu, K. Ikeda, D.J. Gochis, M.P. Clark, J. Dudhia, and G. Thompson, 2012: A Comparison of Statistical and Dynamical Downscaling of Winter Precipitation over Complex Terrain. Journal of Climate, 25, 262–281, doi:10.1175/2011JCLI4109.1
Barstad, I., and S. Gronas, 2006: Dynamical structures for southwesterly airflow over southern Norway: the role of dissipation. Tellus Series a-Dynamic Meteorology and Oceanography, 58, 2-18, doi:doi:10.1111/j.1600- 0870.2006.00152.x
Gutmann et al. (2016) describes the development of ICAR; the ICAR source code is available at https://github.com/NCAR/icar.
U.S. Army Corps of Engineers, Bureau of Reclamation, National Science Foundation