From Education to Research to Operations
The Weather Research and Forecasting (WRF) Model is designed to serve both operational forecasting and atmospheric research needs. It features two dynamic cores, multiple physical parameterizations, a variational data assimilation system, ability to couple with an ocean model, and a software architecture allowing for computational parallelism and system extensibility. WRF is suitable for a broad spectrum of applications, including tropical storms.
Two robust configurations of WRF for tropical storms are the NOAA operational model Hurricane WRF (HWRF) and the National Center for Atmospheric Research (NCAR) Advanced Research Hurricane WRF (AHW). In this website users can obtain codes, datasets, and information for running both HWRF and AHW.
The Developmental Testbed Center and the Mesoscale and Microscale Meteorology (MMM) Division of NCAR support the use of all components of AHW and HWRF to the community, including the WRF atmospheric model with its Preprocessing System (WPS), various vortex initialization procedures, the Princeton Ocean Model for Tropical Cyclones (MPIPOM-TC), the Gridpoint Statistical Interpolation (GSI) three-dimensional ensemble-variational data assimilation system, the NOAA National Centers for Environmental Prediction (NCEP) coupler, the NOAA Geophysical Fluid Dynamics Laboratory (GFDL) Vortex Tracker, and various postprocessing and products utilities.
The effort to develop AHW has been a collaborative partnership, principally among NCAR, the Rosenstiel School at the University of Miami, and the Air Force Weather Agency (AFWA).
The effort to develop HWRF has been a collaborative partnership, principally between NOAA (NCEP, AOML, and GFDL) and the University of Rhode Island.
The community GSI system is a variational data assimilation system, designed to be flexible, state-of-art, and run efficiently on various parallel computing platforms. The GSI system is in the public domain and is freely available for community use.
The Developmental Testbed Center (DTC) currently maintains and supports a community version of the GSI system (now at Version 3.3). The testing and support of this GSI system at the DTC currently focus on regional numerical weather prediction (NWP) applications coupled with the Weather Research and Forecasting (WRF) Model , but the GSI can be applied to Global Forecast System(GFS) as well as other modelling systems.
The GSI version 3.3 GSI is an operational data assimilation system available for community use. Some of these GSI advanced features is listed as follows:
for a complete list of the new functions and changes included in each release version, as well as the observation data can be used in GSI, please check these links: version 3.3 ; version 3.2 ; version 3.1 .
The JNTP is currently supporting the Gridpoint Statistical Interpolation (GSI) system (variational and Ensemble-Variational (EnVar)) and the Ensemble Kalman Filter (EnKF) data assimilation system (ensemble based). Both are operational data assimilation systems used by multiple applications at NOAA, NASA, AF and other facilities and agencies (e.g., HWRF, GFS, RAP, NEMS, etc).
This project started in 2009 with a joint effort between the JNTP (under the auspices of the Developmental Testbed Center) and NCEP/EMC to expand the operational GSI data assimilation system to the research community, with the sponsorship of NOAA, AF and NCAR (supported by National Science Foundation (NSF)). This effort was expanded to the operational EnKF system in 2014. The objectives of this effort are to provide operational data assimilation capabilities to the research community, open the pathway for the research community to contribute directly to daily operations, and, eventually, accelerate transitions from research to operations, which is in line with the mission of the sponsors and the DTC.
This effort has produced a code management framework to unify the distributed development and operational applications for GSI starting from 2010 and, additionally, EnKF starting from 2015. A joint data assimilation scientific steering and code review committee was formed, including major development teams for both systems across the United States. The GSI and EnKF systems and their supplemental libraries and auxiliary files are managed in the Community Data Assimilation Repository under version control (using Subversion). Targeted code tests are organized to maintain code robustness and integrity. General community support is provided through annual code releases, documentation, tutorials, a helpdesk, and assistance with code transitions and tests. Community researchers and users are encouraged to collaborate with the DTC and/or the JNTP to further advance GSI and associated data assimilation techniques, following the same code management procedures as internal developers. The User’s Page for GSI and EnKF can be found at the following links:
Improved weather prediction and precise spatial analysis of small-scale weather events are crucial for energy management, as is the need to further develop and implement advanced technologies. The National Center for Atmospheric Research (NCAR), a leader in atmospheric research, development and technology transfer for more than 50 years, is uniquely qualified to support the renewable energy industry in these endeavors. NCAR scientists are already actively engaged with industry decision makers on how best to foresee and respond to short- and long-term changes in atmospheric conditions to mitigate risks associated with weather, particularly wind and solar energy prediction.

Although there has been a substantial, long-term effort by the weather research community to improve precipitation prediction, little attention has been paid to the prediction of clouds and insolation. The need for accurate insolation prediction is growing as the energy industry increases the percentage of distributed and concentrated solar energy. In addition, smart grid initiatives are expanding and the need for accurate forecasts of insolation (and temperature) is growing in parallel.
NCAR’s Joint Numerical Testbed (JNT) has a mission to test and verify the accuracy of weather models for NOAA and the research community. It is well positioned to assess the accuracy of operational and research models in predicting clouds and solar radiation. The results would highlight model skill and would provide valuable feedback to modelers on accuracy deficiencies. The results would be used to improve the models providing better information in the future to solar energy decision makers.
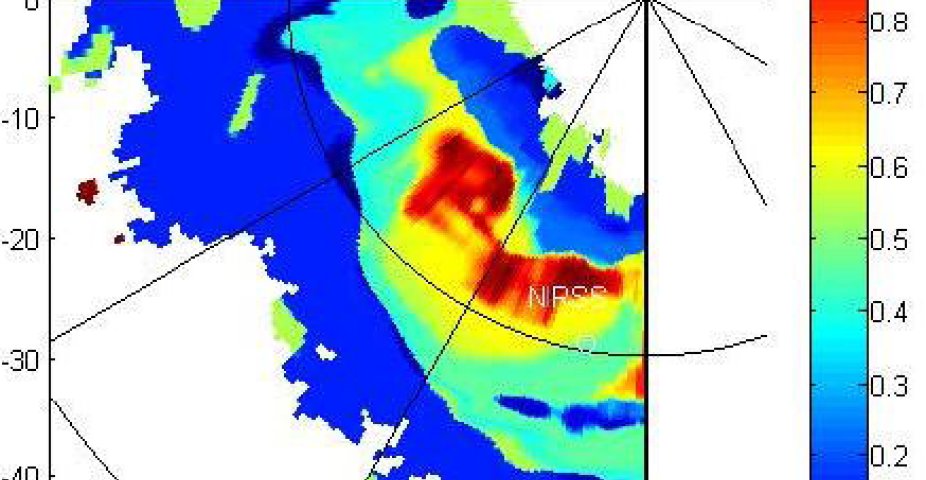
The Radar Icing Algorithm, or 'RadIA', utilizes the polarized moments from the National Weather Service's network of WSR-88D operational radars and the most recent Numerical Weather Prediction model temperature profiles to detect in-flight icing. The algorithm consists of several meta-algorithms for various icing scenario inclusion or non-icing scenario exclusion, the sum of which are combined for a final in-flight icing product.

Research is ongoing to utilize the recent dual-polarimetric upgrade to the National Weather Service operational radar network (WSR-88D) for remote detection of in-flight aircraft icing. It has been well documented that the S-band dual-polarimetric radar signatures at individual range gates of super-cooled liquid water and ice crystals overlap significantly, complicating the identification of icing conditions using individual radar measurements. Recently several investigators have found that the aggregate characteristics of dual-polarimetric radar measurements over regions on the order of several kilometers show distinguishing features between regions containing super-cooled liquid and those with ice only. In NCAR's ongoing study, the features found in the literature are combined using a fuzzy-logic framework to provide an icing threat likelihood. The results of this algorithm are currently being output in realtime for two operational NEXRADs - KCLE in Cleveland, Ohio and KFTG in Denver, CO. During 2016, RadIA will be implemented into NSSL's MRMS platform. The ultimate goal is to produce an end-to-end algorithm which outputs an accurate and reliable icing threat product that can then be combined with existing icing detection systems to improve their performance.


The inputs to RadIA are radar and Numerical Weather Prediction (NWP) model data from the Weather Research and Forecast Rapid Refresh (WRF-RR) model. A simplified version of the RadIA algorithm is shown in the flow chart (at right). Membership functions for specific radar moment fields are utilized to create 'Freezing Drizzle', 'SLW', 'Mixed Phase' and 'Plate-shaped Crystal' Detection Interest maps, and those maps are combined to create the final RadIA product.
Serke, D., Tessendorf, S., Korolev, A., Heckman, I., French, J., Rugg, A., Haggerty, J., and Albo, D., Performance evaluation of a radar-based super-cooled water detection algorithm during the SNOWIE Field Campaign, AMS Radar Conference, Nara, Osaka, Japan, September 15-20th, 2019.
Serke, D., Sarah Tessendorf, Kim Reed, Jeff French, Bart Geerts, David Plummer, Spencer Faber, Bob Rauber, Katja Friedrich, Roelof Bruintjes, Roy Rasmussen, Andrew Janisezski, Levi Blanchette, Alex Schweitzer, Steven Huber, Shao Wen (Amy) Chen, Rachel Gutierrez, Derek Blestrud, Mel Kunkel, Julie Haggerty, and Dave Albo, Initial performance evaluation of a radar-based super-cooled water detection algorithm during the SNOWIE Field Campaign, AMS Radar, Aug 28-Sept 1, Chicago, IL, 2017.
Serke, D., Adriaansen, D., Tessendorf, S., Haggerty, J., Albo, D., and Cunning, G., Super-cooled large drop detection with precipitation radars for the enhancement of operational icing products, AMS Radar, Aug 28-Sept 1, Chicago, IL, 2017.
Johnston, C., Serke, D., Ellis, S., Reehorst, A., Hubbert, J., Albo, D., Weekley, A., Adriaansen, D., Elmore, K., and Politovich, M., Statistical analysis of a radar-based icing hazard algorithm, AMS ARAM Preprint, January 6-10, Austin, TX, 2013.
Serke, D., Scott Ellis, John Hubbert, David Albo, Christopher Johnston, Charlie Coy, Dan Adriaanson and Marcia Politovich, In-flight icing hazard detection with dual and single-polarimetric moments from operational NEXRADs, AMS Radar, September 16-20, Breckinridge, CO, 2013.
Serke, D., King, M. and Reehorst, A, Initial results from radiometer and polarized-radar-based icing algorithms compared to in-situ data, SAE Preprint, Prague, Czech Republic, June 22-25th, 2015. [DOI: 10.4271/2015-01-2153]