Windshear and Turbulence Warning System - Hong Kong
An operational Windshear and Turbulence Warning System (WTWS) was developed for Hong Kong's NewAirport at Chek Lap Kok. The WTWS provides alerts for terrain–and convective–induced windshear and turbulence. The system has been utilized by air traffic controllers and pilots since opening day, 6 July 1998. In addition to providing real–time windshear and turbulence alerts to controllers and pilots, the system provides up to 12–hour forecasts of terminal area turbulence to aviation meteorologists.
Project History
Hong Kong's New Airport at Chek Lap Kok (CLK) is located on partly reclaimed land adjacent to Lantau Island, whose rugged terrain has a maximum elevation of nearly 1,000 meters. Consequently, aircraft operating at the new airport may be affected by significant terrain-induced windshear and turbulence under certain meteorological conditions. In order to enhance safety and operational efficiency at the airport, Weather Information Technologies Inc. (WITI) developed a Windshear and Turbulence Warning System (WTWS) which was installed, tested and has been operational since the airport's opening day, 6 July 1998. Since 1998, the Hong Kong Observatory (HKO) has performed routine evaluations of the system and has made improvements to various sensing systems and wind shear and turbulence detection algorithms.

Hong Kong International Airport
The 44–month project was under the sponsorship of the Hong Kong Observatory. The WTWS development team included WITI, the National Center for Atmospheric Research (NCAR), Hong Kong University of Science and Technology (HKUST), and the University of Wyoming.

Topographical map of the region near Hong Kong's new airport. The highest elevations are above 800 meters.
Components include basic and applied research on wind flow over Hong Kong's terrain, a scientific field study, warning system concept and feasibility studies, system design, development, testing, implementation and training. The WTWS provides real–time hazardous weather information to air traffic controllers and pilots to enhance safety in the terminal area and improve predictions of hazardous weather to support strategic decision making by air traffic managers.
The WTWS is the first system worldwide to provide real–time alerts of terrain–induced turbulence and alerts for both convective and terrain–induced windshear, the WTWS also provides predictions of turbulence caused by terrain and airport surface wind as well as numerical weather prediction guidance. For detection of convective windshear, the WTWS relies partly on the output from a Terminal Doppler Weather Radar (TDWR) at Tai Lam Chung, about 12 kilometers from CLK. The windshear warning system ingests TDWR products including gust front, precipitation intensity, and storm motion, providing an integrated alert system. It generates graphics and text designed for easy interpretation by pilots, controllers, traffic managers and aviation forecasters. It also interfaces with other airport systems, reaching a broader user community including airport authority staff and airline offices.
Prior to the development of the windshear warning system, several studies were conducted in Hong Kong to gain insight into the meteorological conditions near the location of the new airport. These studies included analysis of routine weather observations, special observing programs and meteorological modeling of the differences between the existing Kai Tak Airport and the new airport. Variables that were analyzed included wind direction and speed, temperature, clouds, visibility, rainfall, thunderstorms and fog. Methods used to conduct these studies included investigative flights by light aircraft and water tank and wind tunnel experiments.
The probability of significant turbulence and windshear at Chek Lap Kok during specific meteorological conditions prompted the Hong Kong government to create the WTWS program. It was designed to investigate the detailed wind flow environment near the airport site and based on the scientific results, build and implement an operational windshear and turbulence warning and forecasting system. Following a competition, the project was awarded to Weather Information Technologies Inc. in October 1993.
Note: The WTWS was previously known as the OWWS – the Operational Windshear Warning System.
WTWS Products

The Hong Kong graphical display.

Example of animated replay of recent product history.
The primary WTWS product suite includes detection of terrain-induced turbulence, terrain-induced windshear, convective microburst and windshear, gust fronts, precipitation intensity and storm motion. It also predicts terrain-induced turbulence and airport surface wind and guides mesoscale numerical weather prediction guidance. The graphical and text formats are easily interpreted by pilots, controllers, air traffic managers and aviation forecasters. The alerts use commonly accepted aeronautical navigation terminology.
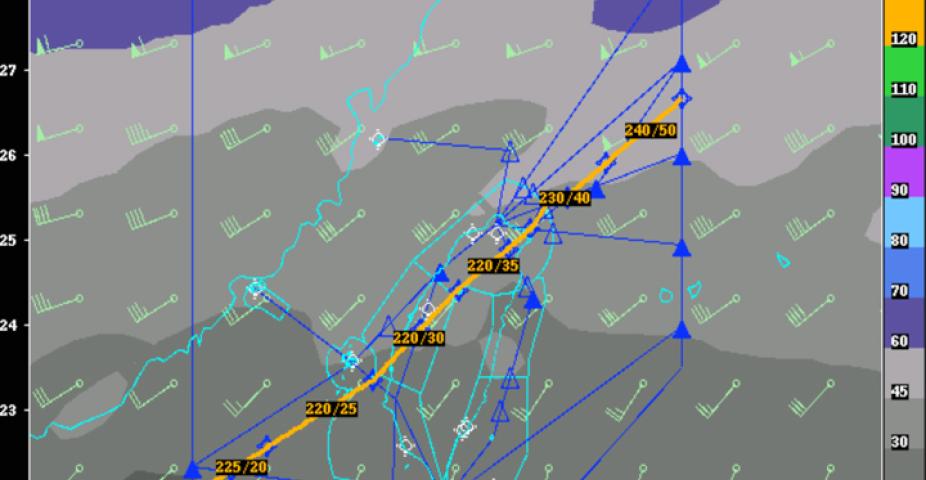
The WTWS graphic display (above) delivers hazardous weather warning information and other meteorological products. It shows the horizontal profile of various hazardous weather areas, vertical wind profiles near the approach and departure corridors, and textual warning messages. The meteorological situation is displayed in several user-selectable ranges and levels of detail. Critical products and important situation changes are highlighted visually on the display and/or announced by audible signals.
User needs were established over a two-year period culminating in a prototype demonstration in October 1995. As a result of comments by users, the system was designed to provide high performance, distinguish between the phenomena of windshear and turbulence, use existing aeronautical terminology and provide spatial extent of the phenomena as well as 12-hour forecasts of windshear and turbulence at a 30-minute resolution.
 for Hong Kong.")
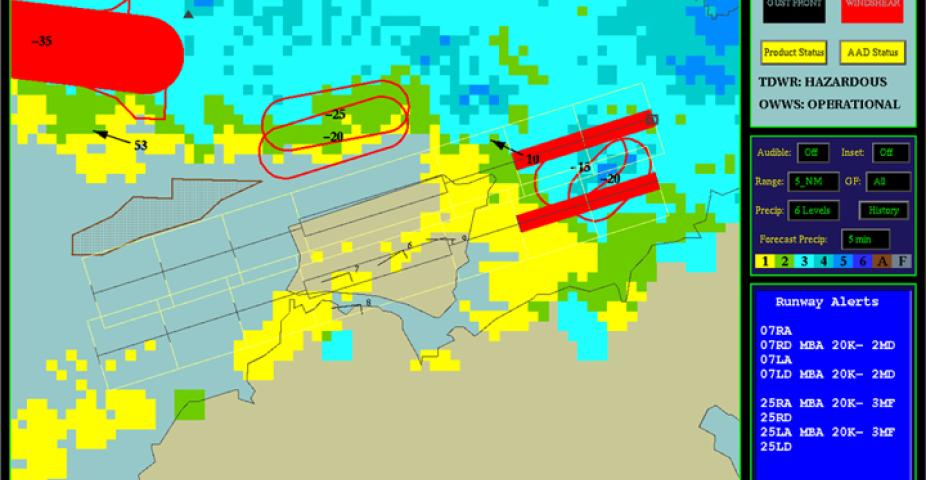
Example of an Alphanumeric Alarm Display (AAD) for Hong Kong.
Alerts had to be reserved for significant events and assigned a priority. They also had to be concise but informative and provided within three nautical miles of runways. Products had to support both tactical and strategic decision making and be updated fast enough to cover operations that occur every two minutes.
The alphanumeric alarm display (above) is designed to alert controllers to time-critical weather hazards and to provide textual warnings for communication to pilots. Alerts are given as microburst, windshear or turbulence, with associated intensity and location. For windshear and microburst alerts, intensity is given as headwind "loss" or "gain" in knots; for turbulence, intensity is specified as "moderate" or "severe". The intensity is the maximum expected along the alert corridor and the alert location is where the event is first expected to be encountered. Event locations for windshear alerts are given as one, two or three nautical miles on approach or departure - or on the runway. Event locations for turbulence alerts are identified as departure or approach.
WTWS Status
The Hong Kong Windshear and Turbulence Warning System (WTWS) research and development program, previously known as the Operational Windshear Warning System (OWWS) program, successfully concluded in January 1998. The Hong Kong Government accepted the WTWS system on schedule in July 1997.
Hong Kong International Airport opened its new international airport at Chek Lap Kok (CLK) in July 1998. The WTWS system has been operating since the airport opened. The WTWS is providing windshear and turbulence alerts to pilots arriving or departing the airport when conditions warrant. Input from pilots and controllers is being used to evaluate and tune the system.
Meteorological Reviews
One of the first program tasks was to perform a meteorological review and analysis of historical Hong Kong data. An initial report included a review of scientific theory on airflow around complex terrain, analysis and identification of the conditions which could cause terrain–induced windshear and turbulence near Chek lap Kok, numerical experiments aimed at gaining additional insight into conditions that produce windshear caused by terrain, and an estimate of the timing and location of significant windshear at the new airport.
That review indicated that the primary parameters for determining the nature of the airflow include wind direction and speed, stability, and the presence of critical levels. These parameters were further studied by performing small–scale modeling simulations using the Clark model of a wide range of atmospheric phenomena such as downslope winds, gravity waves and wave amplification, which are often associated with terrain–induced wind flow perturbations. Preliminary results indicated that both mechanical and gravity–wave processes contribute to windshear and turbulence and confirmed that the intensity and location of the turbulence are sensitive, among other things, to wind direction, speed and stability.
A study of test flight results indicated that terrain–induced windshear and turbulence was not related to a single weather phenomenon and should be expected at any time of year. The atmosphere during the turbulence events was variable, although wind speed appeared to have a dominant role in determining intensity. Using 10 years of data, it was found that significant episodes of terrain–induced windshear and turbulence could last from a period of several hours up to a number of days since they were governed by long–term atmospheric motions. Principal phenomena likely to affect aircraft operations at Chek Lap Kok include crosswinds, longitudinal windshear, large wind changes, turbulence, updrafts and downdrafts. It was unclear which condition, if any, would dominate.
Using the knowledge gained from preparing the first meteorological report and from other sources, WITI designed a field experiment to understand fine–scale wind flow in the vicinity of Chek Lap Kok. The basic objectives of the experiment, which was conducted between March 1994 and September 1995, were to quantify the frequency and severity of turbulence and windshear; define more clearly the meteorological conditions under which significant terrain–induced windshear and turbulence occur; validate airflow predictions made by the small–scale model; determine the elements necessary to develop the windshear warning system; and collect verification data.
The major observational platforms used in the field experiment included a King Air research aircraft operated by the U.S. National Center for Atmospheric Research, a scanning Doppler light detection and ranging (lidar) device, integrated sounding system, wind profiler and a network of surface weather stations. Digital flight data from Cathay Pacific B–747–400s operating at Hong Kong also were collected.
Principal findings of the second meteorological report generally supported the conclusions of previous studies. It indicated that moderate to severe terrain–induced turbulence occurs in the vicinity of Chek Lap Kok and that it is more frequent than terrain–induced windshear. Turbulence is found almost exclusively in a well–defined region in the wake of the surrounding terrain. Ambient wind speed determines the magnitude of this turbulence, whereas ambient wind direction governs location. Other factors, such as stability, affect the wind flow response but are secondary.
Both mechanical and gravity–wave processes appear to be important in the dynamics and the net response of both processes appears to be quasi–linear and similar. There is no indication of resonance or unusual responses. Significant terrain–induced windshear and turbulence will occur in episodes that are typically several days in duration and separated by several weeks.
The wealth of scientific information provided by the field study was used in the design of the WTWS system. Coupled with feedback from controllers, pilots and aviation meteorologists, this information was used to develop an operational concept for the new alerting system.
Engineering Design

WTWS graphical display
Designers developed the WTWS products to enhance the safety, capacity and efficiency of operations at Chek Lap Kok by automatically providing pilots with concise windshear and turbulence alerts. The system also was designed to provide air traffic managers and supervisors with information to aid effective decision–making and to present high–resolution, real–time meteorological data and forecast guidance to forecasters.
The WTWS integrates data from various sensors and sources, including anemometers, Doppler weather radar, Doppler wind profilers, numerical weather prediction models and an array of global weather observations. Indirectly, it receives data from the ICAO world area forecast system (WAFS) and the World Meteorological Organization (WMO) global telecommunications system.
To enhance flexibility, the system was designed to run on commercially available Unix platforms. Modular system software, written in the C and Fortran programming languages, was designed to conform to international standards, allowing WTWS to run on vendor–neutral platforms. To heighten reliability, a redundant array of independent computers environment was employed. This ensures that all critical system processes are running somewhere on a network of WTWS computers. The capability to refine or tune system algorithms after, as well as before, installation is an important feature because optimization can be achieved only after it is used in an operational environment. The system also includes provisions for accommodation of new types of data, such as real–time aircraft and lidar data, after initial deployment.
An advanced version of the mesoscale model (MM5) developed by Penn State University and NCAR is used to predict atmospheric conditions around the new airport. The MM5 modelling system was adapted to provide real–time, short–range prediction of the mesoscale atmospheric conditions conducive to terrain–induced windshear and turbulence.
Although the MM5 produces weather guidance for the entire Hong Kong region, airport–specific forecasts are generated with a post-processing algorithm. Similar to model output statistics (MOS) techniques commonly used at major forecast centers, this algorithm provides 12–hour forecasts with 30–minute resolution of wind and turbulence at Chek Lap Kok.
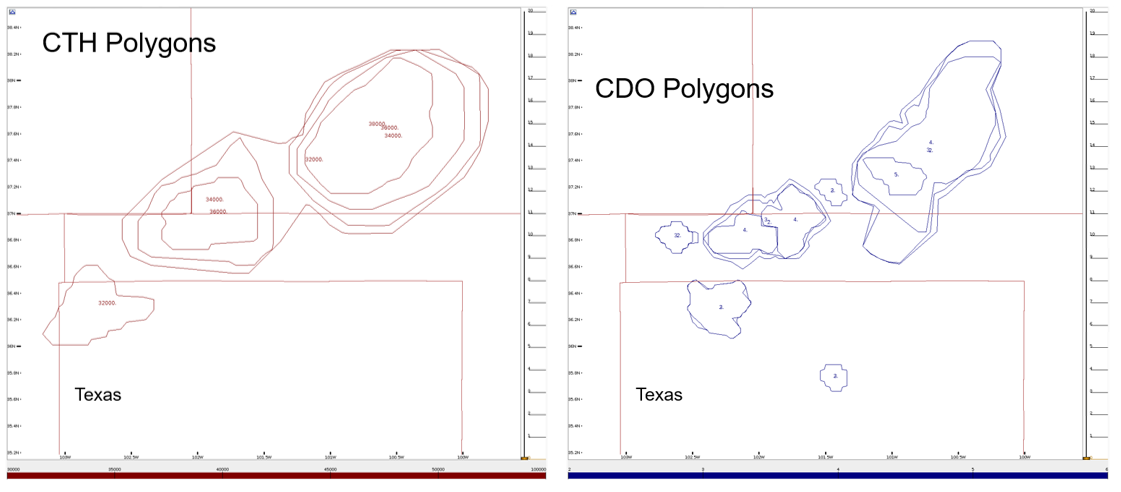
The WTWS algorithms, many of which utilize an analysis technique known as 'fuzzy logic', produce turbulence and windshear products based on sensor data. This technique makes use of disparate data types and keeps important information throughout the decision process, maximizing algorithm performance. Sensor inputs include automatic weather stations, TDWR, and an aerodrome meteorological observing system – and each is used by specific windshear and turbulence detection algorithms. The weather product algorithms are used to produce gridded information, which is integrated using decision algorithms. By employing such a scheme, a new turbulence or wind shear algorithm can be added to the system by tailoring its output to a standardized format.
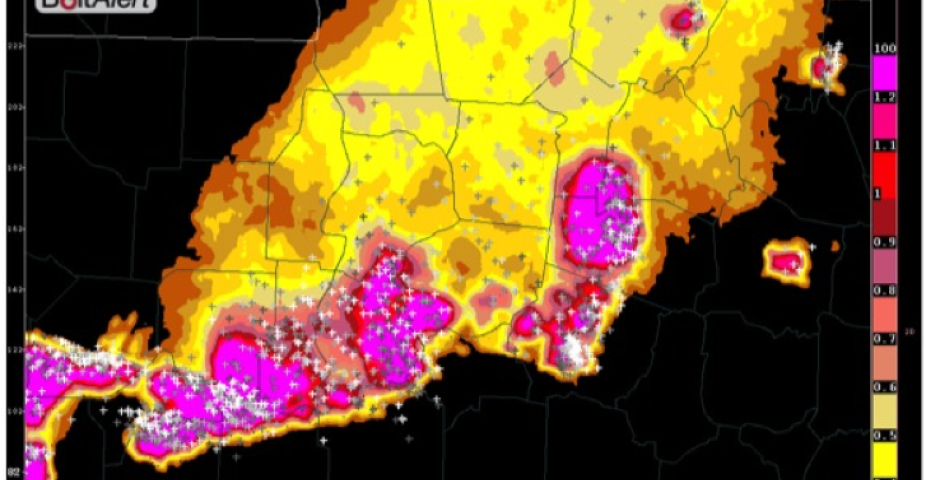
 and actual strikes.")


 for Hong Kong.")


")
")

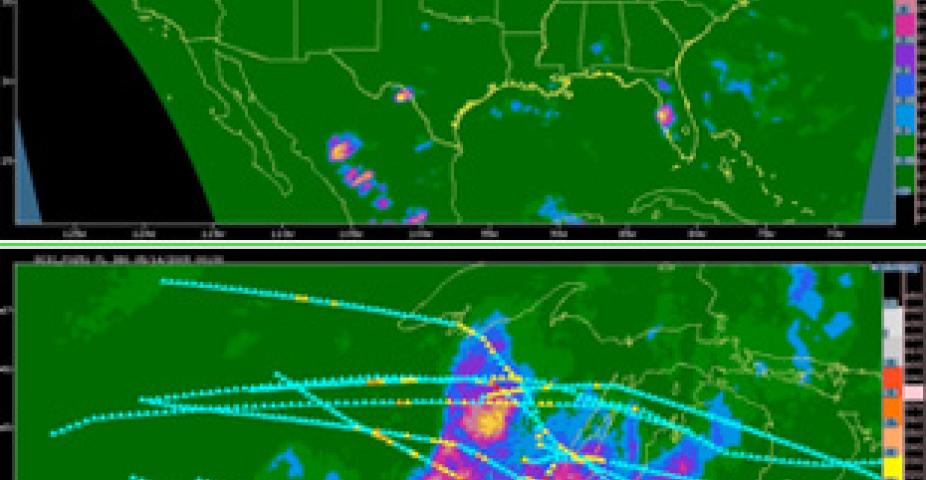
 from UAL mostly 757–200 aircraft (top panel), with one–minute routine reporting and DAL 737–800 aircraft (bottom panel) with event–based EDR reporting plus 15–minute routine reporting.")
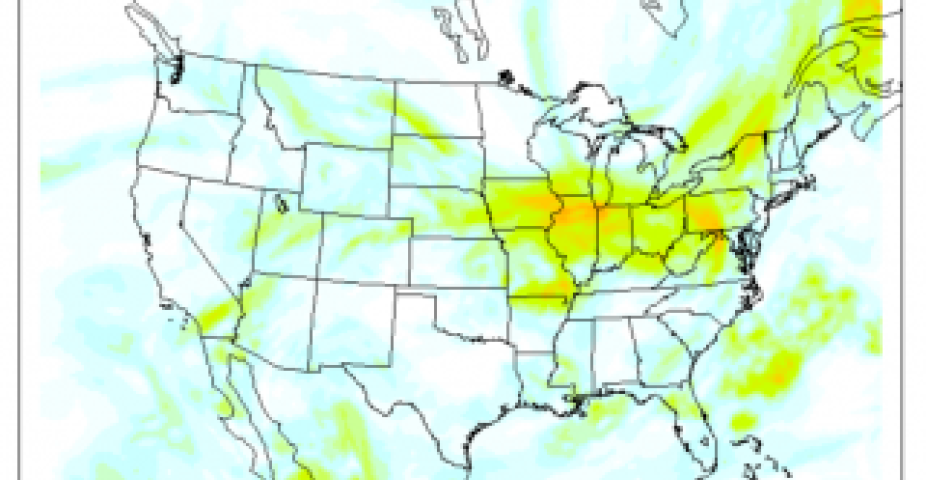

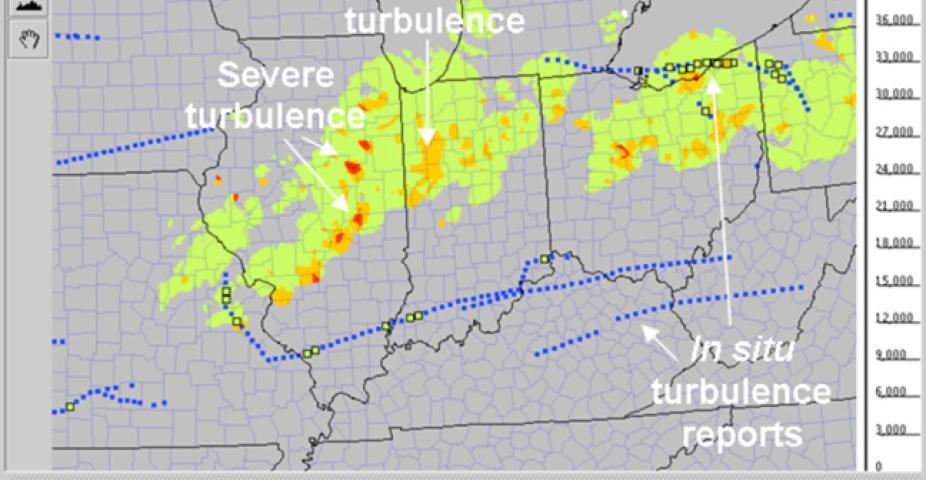
 blowup image of the upper Midwest showing overlaid 1–hr in situ EDR tracks validating the DCIT diagnosis. (Note that there are temporal offsets between the DCIT analysis time and some of the EDR measurements, so the correlation is not exact.)")


, visiting engineer from the CAA in Taipei, is working on the MDS display at the AOAWS lab in Boulder.")
, a visiting engineer from the CAA in Taipei, working on the AOAWS MDS display at the Boulder lab.")
