Sensor Data Fusion (SDF)
Objective
Technology developed in this project utilizes Chemical, Biological, Radiological, Nuclear (CBRN), and meteorological sensor readings along with transport and dispersion models to characterize unknown CBRN source properties and refine CBRN downwind hazard assessments.
Description

The Sensor Data Fusion (SDF) project is developing tailored meteorological decision-support applications for the military and domestic emergency-response communities. In particular, these applications are used to enhance DoD's Chemical, Biological, Radiological, and Nuclear (CBRN) hazard prediction toolsets such as the Hazard Prediction and Assessment Capability (HPAC) and more recently the Joint Effects Model (JEM).
A main goal is developing an operational algorithm that can estimate an unknown CBRN source and predict a refined downwind hazard from that source while using available CBRN and meteorological sensor observations. Integrating this algorithm into the HPAC/JEM hazard-prediction toolsets will also be addressed.
To support testing and evaluation of this product, RAL is also developing a virtual testing and evaluation environment, known as Virtual THreat-Response Emulation and Analysis Testbed (VTHREAT). This will provide the capability of simulating a realistic CBRN release scenario, placement of CBRN and meteorological sensors, and extraction of the resulting synthetic sensor readings. These synthetic observations can then be used by the algorithms to evaluate their ability to recreate the CBRN event.
While most of the work on this project is technology-development oriented, the ultimate objective is to implement a verified and validated SDF algorithm within the JEM framework for operational use in the battlefield and for non-wartime emergency response activities.
Technologies
SCIPUFF Dispersion Model from L3-Titan
The SCIPUFF (Second-order Closure Integrated PUFF) model is a Lagrangian puff dispersion model developed by Titan's ARAP Group that uses a collection of Gaussian puffs to represent an arbitrary, three-dimensional time-dependent concentration. The turbulent diffusion parameterization is based on turbulence closure theory, providing a direct relationship between the predicted dispersion rate and turbulent velocity statistics of the wind field. In addition to the average concentration value, the closure model also provides a prediction of the statistical variance in the concentration field resulting from the random fluctuations in the wind field. The closure approach also provides a direct representation for the effect of averaging time. SCIPUFF has been incorporated into the Defense Threat Reduction Agency's (DTRA) Hazard Prediction and Assessment Capability (HPAC) software. HPAC is utilized for planning and analysis as well as in the field by military personnel to rapidly determine consequences of dispersing chemical, nuclear and biological agents. SCIPUFF has been validated against a number of laboratory and field experiments, demonstrating its usefulness for non-military applications. It has been recommended as an alternative model by the EPA which can be used on a case-by-case basis for regulatory applications. The publicly available version of SCIPUFF is the same version incorporated in HPAC except that the proprietary and developmental features have been disabled. SCIPUFF runs on a PC with a user-friendly Graphical User Interface (GUI).
For more information http://www.titan.com/products-services/336/index.html?docID=336
MM5/WRF
MM5 is a numerical weather model developed by NCAR and the Pennsylvania State University. It is designed to simulate and predict mesoscale atmospheric circulations.
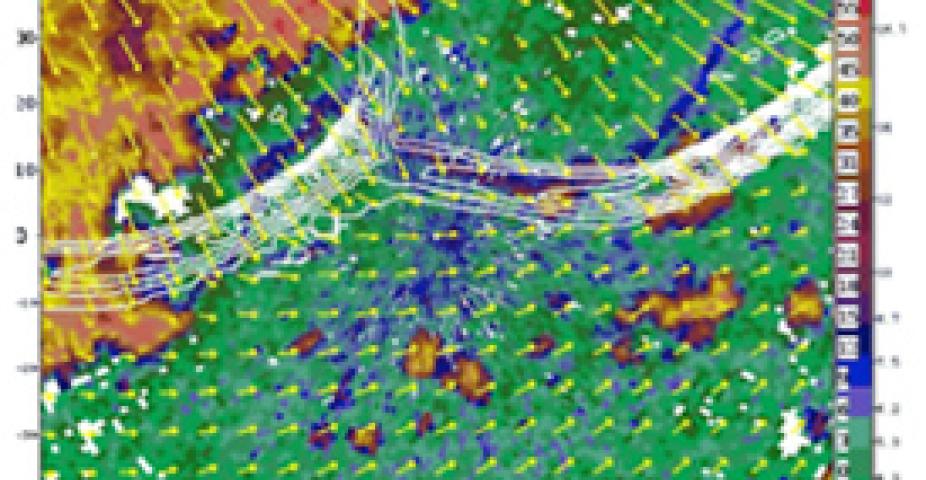
Variational Doppler Radar Assimilation System (VDRAS)
Developed at RAL, VDRAS provides detailed and frequently updated information on wind, rain, and other real-time weather variables. VDRAS is the first real-time system to diagnose low-level wind and temperature over a wide region using four-dimensional data assimilation of Doppler radar data.
Lagrangian Particle Dispersion Model (LPDM)
The emission, transportation, diffusion, and deposition of tracers can be computed in WRF-chem by turning off chemistry. Lagragian particle models that compute trajectories of a large number of particles (infinitesimally small air parcels) is another way to show the transport and diffusion of tracer in the atmosphere. The main advantage of Lagrangian models is that, there is no numerical diffusion. The Lagrangian system is independent of a computational grid and can resolve diffusion near point sources. Lagrangian models can also be used to determine source-receptor relationships and air mass trajectories.
Eulerian Lagrangian (EULAG) Large Eddy Simulation (LES)
EULAG is a numerical solver for all-scale geophysical flows. The underlying anelastic equations are either solved in an EULerian (flux form), or a LAGrangian (advective form) framework. EULAG model is an ideal tool to perform numerical experiments in a virtual laboratory with time-dependent adaptive meshes and within complex, and even time-dependent model geometries. These abilities are due to the unique model design that combines the nonoscillatory forward-in-time (NFT) numerical algorithms and a robust elliptic solver with generalized coordinates. The code is written as a research tool with numerous options controlling the numerical accuracy and to allow for a wide range of numerical sensitivity tests. These capabilities give the researcher confidence in the numerical solutions of his/her problem. The formulation of the model equations allow for various derivatives of the code including codes for stellar atmospheres, ocean currents, sand dune propagation or biomechanical flows. EULAG is a fully parallized code and is easily portable between different platforms.
Conference Publications and Presentations
Dr. Paul E. Bieringer. Chem/Bio Hazard Assessment and Refinement Through Sensor Data Fusion. September, 2007.
George Bieberbach. DTRA Weather Services Research and Development. December, 2005.
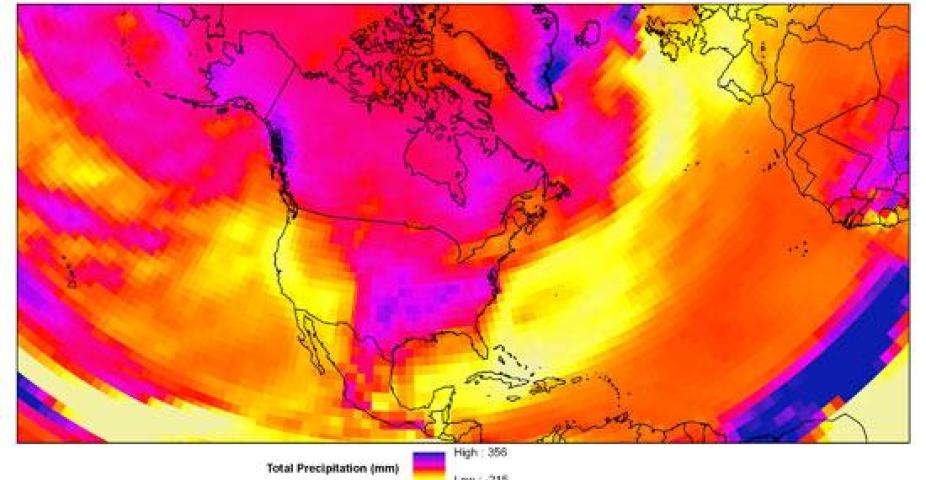
 mapping and graphing capabilities to visualize possible temperature and precipitation changes throughout the 21st century.")


