Advanced Operational Aviation Weather System (AOAWS)

AOAWS Display
Map of Taiwan
Map of Taiwan

Advancements in science and technology, particularly computer and networking capacity, have allowed many civil aeronautics authorities to expand and modernize their aeronautical weather capabilities and services with the intention of providing their end users with more timely, accurate, and ready to use weather information. The primary objective of developing and implementing an advanced capability is to provide high-resolution four-dimensional (space and time) aviation weather products to meteorologists, pilots, air traffic controllers, and airline dispatchers and station operators in order to enhance flight safety and aviation system capacity.

Since 1998, the National Center for Atmospheric Research (NCAR) has been partnered with the Taiwan Civil Aeronautics Administration (CAA) to develop an advanced aviation weather system called the Advanced Operational Aviation Weather System (AOAWS) for Taiwan aviation system users. NCAR's local Taiwan partner on the project includes the Institute for Information Industry (III) (1998- 2008) and InfoExplorer Ltd. (2009 to 2010), and International Integrated Systems, Inc. (2011 to present). The main objective of the AOAWS is to enhance operational safety, capacity and efficiency in the terminal and Taipei Flight Information Region (FIR). The AOAWS product suite is designed to aid both tactical and strategic decision making for the direct users of the system, specifically pilots, controllers, traffic managers, and forecasters at the Taipei Aeronautical Meteorological Center (TAMC) supporting the formulation of aviation weather products.

Illustration of the major components of the AOAWS. The WMDS is the Web-based Multi-dimensional Display System, an integrated display including all relevant aeronautical weather information. A high-resolution numerical weather model is at the heart of the system.

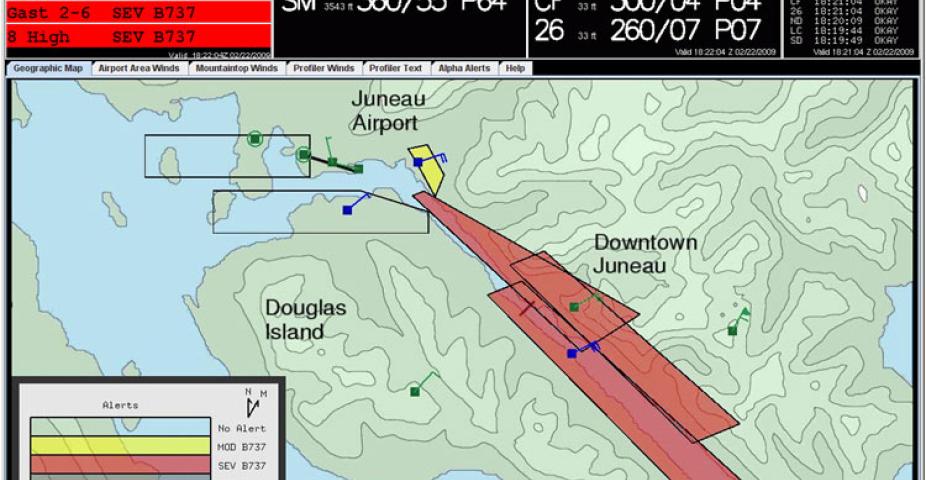
The AOAWS system includes Low-Level Windshear Alert Systems (LLWAS) at Taiwan Taoyuan International Airport (TTY) and Sungshan Airport, advanced aviation weather display systems at the Taipei Aeronautical Meteorological Center (TAMC), Taipei Flight Information Service (FIS), Sungshan Weather Station, TTY Weather Station and FIS, Kaohsiung Weather Station and FIS, and the Taipei Area Control Center (TACC). The AOAWS also includes a World Wide Web system that allows airlines, pilots and other aviation system users to have remote access to AOAWS products.

The AOAWS operational concept has been developed by coupling user requirements with current scientific and engineering capabilities. Extensive experience gained by NCAR during development, deployment and operation of the Terminal Doppler Weather Radar (TDWR)Low-Level Windshear Alert System (LLWAS) and other advanced aviation weather systems for theFederal Aviation Administration (FAA) in the U.S. and the Windshear and Turbulence Warning System (WTWS) for Hong Kong provides a solid framework for an AOAWS operational concept.

AOAWS System Overview

Advanced aeronautical weather systems, such as the AOAWS, typically include a high-resolution weather model, model data post-processing system for calculating aviation impact variables such as icing and turbulence, display systems that allow users to interactively view weather products both in plan view and along flight routes, and servers to disseminate the information to end users in remote locations. A conceptual illustration of the AOAWS is shown below.

User Needs

The best starting point for developing an operational concept is to review the issues and needs raised by the future users of the AOAWS. User needs were developed during meetings held in Taipei in 1996, 1997 and 1999. Organizations represented in the meetings included the Taiwan Civil Aeronautics Administration (CAA), Far Eastern Transport (FAT), China Airlines, EVA Air, Air Force Meteorological Center, Central Weather Bureau (CWB), TransAsia, Hwa Hsin Airlines, Formosa Airlines and U-Land Airlines.

Chun-Ming Jou (So-So), visiting engineer from the CAA in Taipei,  is working on the MDS display at the AOAWS lab in Boulder.
Chun-Ming Jou (So-So), visiting engineer from the CAA in Taipei,  is working on the MDS display at the AOAWS lab in Boulder.

Major issues considered in the development of AOAWS concepts:

  1. Convective windshear (including microburst) detection in the terminal areas has higher priority than other advanced aviation weather products.
  2. Terrain-induced windshear and turbulence in the terminal area has the second highest priority.
  3. Thunderstorm hazards in the terminal area are important followed by thunderstorm hazards in the domestic enroute region and lastly in the FIR region. Thunderstorm hazards include windshear, turbulence, lightning, and to a lesser extent, icing.
  4. Knowledge of airport surface winds and ceiling and visibility are necessary for safe operations. Better forecasts of those conditions are highly desired.
  5. For flight planning, accurate information (current and forecast) of winds and temperature aloft are required.
  6. The users agreed that better weather detection and forecasts accuracy for all aviation weather information is desired.

With this in mind, a number of considerations for AOAWS development were reviewed and accepted. AOAWS design considerations include:

  1. The windshear systems – Low–Level Windshear Alert Systems (LLWAS) and the Windshear Processor (WSP) – should have a high Probability of Detection (POD) and low False Alarm Rate (FAR).
  2. If more than one sensing system is used for hazards detection, the resulting alert information should be based on an integrated approach.
  3. Terminal alert information should be concise to keep the controller workload low.
  4. The AOAWS should use standard terminology for describing weather phenomena. For example, products such as flight categories should use standard definitions for IFR, VFR, etc., and standard terms should be used for turbulence and windshear. Event intensities should also be given using standard terminology.
  5. Alert conditions should be reserved for operationally significant (safety critical) events.
  6. Crosswind shear may be an operational problem at some airports, particularly at CKS and Kaohsiung.
  7. Vertical windshear is thought to be a common occurrence at CKS. More research is needed to understand this phenomenon and determine whether it is an aviation hazard.

The windshear alert generation strategy should be consistent with FAA and other established systems. For example:

  1. Alerts should be provided, where possible, out to 3 nm on approach and departure.
  2. Alert update rate should be approximately 60 seconds or faster.
  3. The alert corridor around the runways should be 1/2 nautical mile wide on either side of the centerline to account for windshear event movement.
  4. Windshear alerts should be provided as gains or losses in wind speed (knots).
  5. The minimum windshear alert threshold should be 15 knots.
  6. The minimum microburst threshold should be 30 knots (windspeed loss).
Ching-Huei Hsu (Jeff ), a visiting engineer from the CAA in Taipei,  working on the AOAWS MDS display at the Boulder lab.
Ching-Huei Hsu (Jeff ), a visiting engineer from the CAA in Taipei,  working on the AOAWS MDS display at the Boulder lab.

Terminal Windshear Systems

From an operational perspective, the AOAWS windshear detection component provides two major functions:

  1. To improve safety by providing tactical decision making information to pilots for windshear events.
  2. To provide strategic meteorologists at the weather stations for use in decision-making for optimizing terminal efficiency and capacity.

Because airspace is limited, especially during bad weather, it will be important to utilize all available AOAWS information in order to optimize operations.

Maximizing the utility of the AOAWS windshear components is a function of how the system is ultimately used in an operational environment and this is governed by its capabilities and performance.

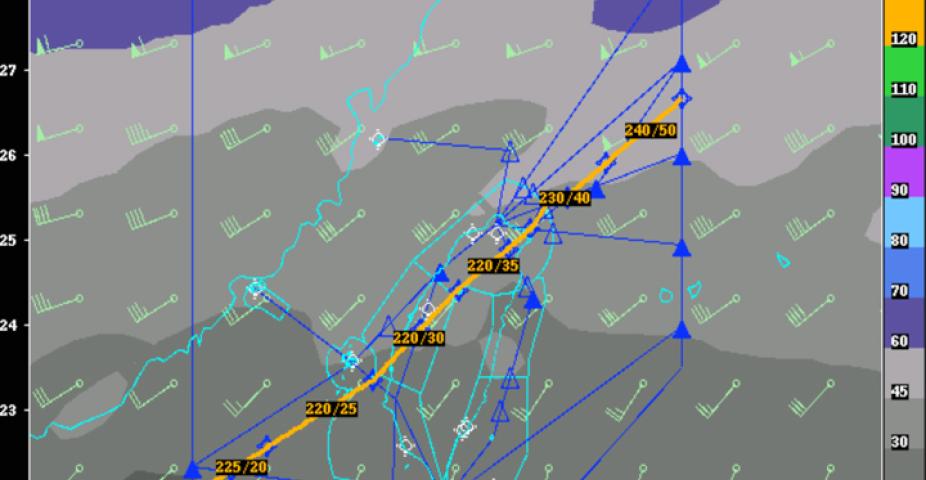
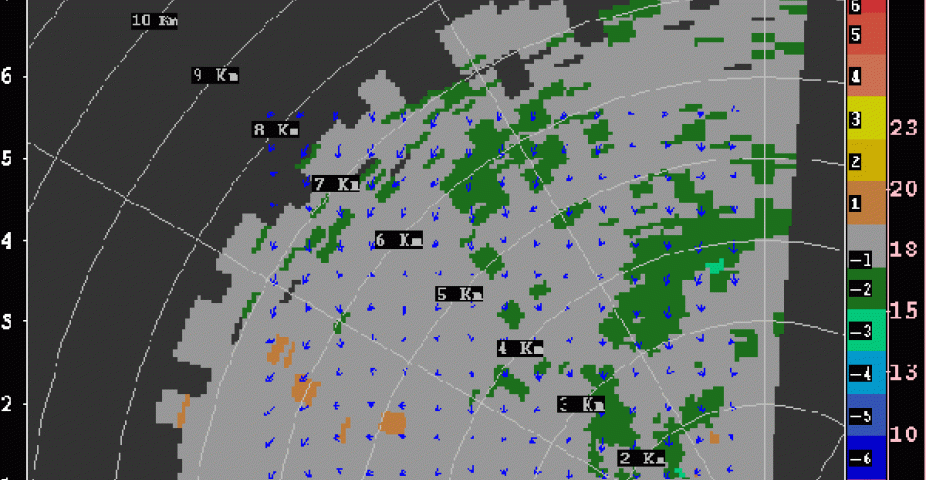
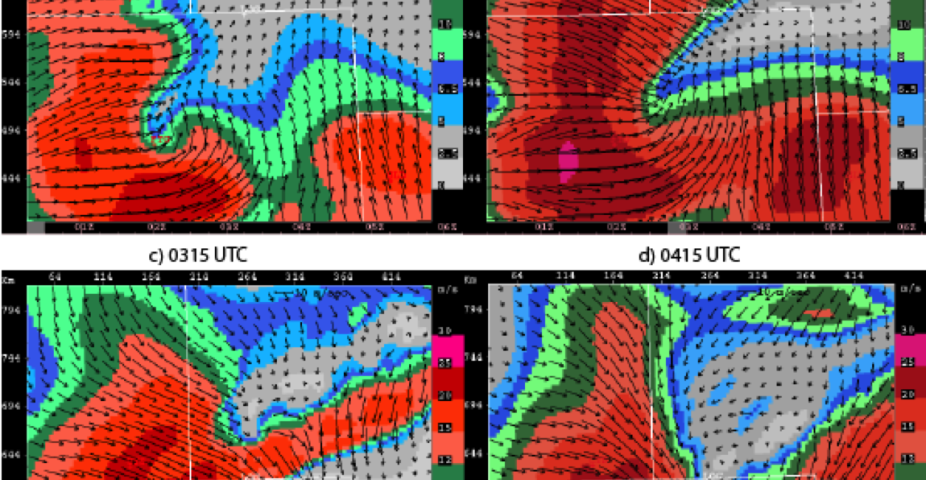
Convective Windshear and Microburst Products

Microbursts are well recognized as an aviation hazard. Until the U.S. TDWR and Enhanced LLWAS systems were developed and implemented, no explicit microburst alerts were available. Onboard reactive windshear devices now provide windshear alerts to help pilots recognize that they have entered a windshear event, but they are reactive and do not provide an alert that can help pilots avoid windshear before they enter the event. Forward-looking systems are now just coming into operation and these will provide alerts of a minute or two ahead of entering windshear events. The ground-based systems (TDWR and LLWAS), which define microbursts as windshears with peak-to-peak windspeed differences of > 30 kts over distances < 2.5 nm, have microburst probabilities of detection (PODS) > 90% and false alarm rates (FARs) < 10%. Due to the high performance, the U.S. airlines have developed the policy that aircraft operations (approaches or departures) must cease if a "microburst alert" is given by these systems. When the TDWR or LLWAS systems generate a "windshear-with-loss alert", which is defined as a peak-to-peak windspeed difference of 15-29 kts over a distance of < 2.5 nm, it is up to the pilot to determine whether to continue operating.

Convective windshear events and microbursts typically last about ten minutes. This short duration is due to a combination of the true life cycle of the events coupled with the fact that they are usually moving with the precipitation cells. At times when the precipitation cells are moving more slowly (< 20 kts), the windshear events may impact the airport operations for a longer period. The avoidance of the hazard is an obvious safety benefit; however, every delayed departure and missed approach will disrupt the traffic flow and hence, impact capacity (if airspace is limited). The geographical information provided to the air traffic supervisors and managers on the GSD provides an opportunity to see the "bigger picture" and minimize disruptions.

An example of an AOAWS web system homepage

Web System Format And Style

The AOAWS Web System will be styled after a Web system that was developed by NCAR and NOAA for the NWS Aviation Weather Center (AWC) in Kansas City, Missouri. The complete AWC Web System can be viewed here: www.aviationweather.gov

The web system developed for AWC was first implemented in 1996. Since that time it has evolved from a gridded data server to an excellent resource for accessing world wide aviation weather information. The AWC system was designed for non-meteorologists (pilots, airline dispatchers, etc.) and its interface is simple and intuitive.

The AOAWS Web system will follow the general style of the AWC system for the following reasons:

  1. The AWC system has been developed with extensive user input
  2. The AWC system is very successful
  3. The aviation community will have continuity between the AWC system and the AOAWS system lessening the time necessary to become comfortable with its use
  4. NCAR has experience in developing the AWC system and can incorporate many of the features and functions of the AWC system into the AOAWS Web system

After the completion of the AOAWS Web system, a Chinese language interface will be created in the appropriate places. The Help function will also be converted to Chinese to make it easier for Chinese speaking users to interpret the products.

Partners

Contact

Please direct questions/comments about this page to:

Rong-Shyang Sheu

R software packages

R software packages

What is R?

Introduction to R

R is a language and environment for statistical computing and graphics. It is a GNU project which is similar to the S language and environment which was developed at Bell Laboratories (formerly AT&T, now Lucent Technologies) by John Chambers and colleagues. R can be considered as a different implementation of S. There are some important differences, but much code written for S runs unaltered under R.

R provides a wide variety of statistical (linear and nonlinear modelling, classical statistical tests, time-series analysis, classification, clustering, ...) and graphical techniques, and is highly extensible. The S language is often the vehicle of choice for research in statistical methodology, and R provides an Open Source route to participation in that activity.

One of R's strengths is the ease with which well-designed publication-quality plots can be produced, including mathematical symbols and formulae where needed. Great care has been taken over the defaults for the minor design choices in graphics, but the user retains full control.

R is available as Free Software under the terms of the Free Software Foundation's GNU General Public License in source code form. It compiles and runs on a wide variety of UNIX platforms and similar systems (including FreeBSD and Linux), Windows and MacOS.

R software packages [LINK: https://www.r-project.org/]

METplus

Model Evaluation Tools (METplus)

METplus is the overarching, or umbrella, repository and hence framework for the Unified Forecast System verification capability.

METplus is a verification framework that spans a wide range of temporal (warn-on-forecast to climate) and spatial (storm to global) scales.  It is intended to be extensible through additional capability developed by the community. The core components of the framework include MET, the associated database and display systems called METviewer and METexpress, and a suite of Python wrappers to provide low-level automation and examples, also called use-cases.  METplus will be a component of NOAA's Unified Forecast System (UFS) cross-cutting infrastructure as well as NCAR's System for Integrated Modeling of the Atmosphere (SIMA).

METplus logo

METplus is being actively developed by NCAR/Research Applications Laboratory (RAL), NOAA/Earth Systems Research Laboratories (ESRL), NOAA/Environmental Modeling Center (EMC), and is open to community contributions.


Variational Lidar Assimilation System (VLAS)

Variational Lidar Assimilation System (VLAS)

VLAS represents the Doppler lidar variant of VDRAS.  VLAS provides very high-resolution wind information at the neighborhood scale and has been used to study atmospheric transport and diffusion in urban environments.

Contact

Please direct questions/comments about this page to:

Jenny Sun

Senior Scientist

email

Fine-Scale Analysis and Nowcast System (FINECAST®)

FINECAST®

FINECAST® Nowcasting System: High Resolution Analysis

Improving Nowcasting via Data Assimilation

Fine-Scale Analysis and Nowcast System (FINECAST®) is used by the research community to study convective weather-initiation mechanisms, as well as by the operational community to improve nowcasting. Since 1998, FINECAST® has been implemented in real time for severe-weather nowcasting, wind-energy prediction, hazardous-chemical detection, and model initialization. The code is fully parallelized by a MPI (Multiple Processing Interface) to handle the computation demand of the 4DVar  scheme so that each analysis can be produced in a few minutes with an update frequency of 10 minutes to meet the nowcasting requirement.

High-density and frequent observations 

Scientists and engineers developed the fine-resolution analysis and nowcasting system, named  FINECAST® (previously known as Variational Doppler Radar Analysis System), based on high-density and frequency observations, such as those from Doppler radars and surface  networks. The core technology of FINECAST® is a 4-dimensional variational (4DVar) data-assimilation system within a convection-permitting model. By making use of the observations at more than one-time levels, the model trajectory of a specified time window is fitted to the observations and meteorological analyses of observed and unobserved variables. These analyses could not otherwise be obtained from operational NWP models because they are primarily based on large-scale observations.

HIGH-RESOLUTION ANALYSIS

Rapidly updated high-resolution meteorological analysis is a key requirement for accurately forecasting hazardous weather events. Operational Doppler radar networks provide temporally and spatially high-resolution observations, but they are limited to radial wind and reflectivity.  Variables of 3-dimensional wind, temperature, and microphysics that provide the whole picture must be retrieved from these limited observations.

3D PICTURE OF CONVECTIVE STORMS

A critical step toward improved nowcasting capability for convective storms is understanding their initiation and evolution mechanisms. FINECAST® helps researchers and forecasters identify thunderstorm predictors and develop conceptual models for convective-weather nowcasting. By fitting model trajectories to observations using the 4DVar technique, dynamically consistent meteorological fields are retrieved.

From these retrieved fields, dynamical and thermodynamical diagnostic fields, such as divergence, updraft/downdraft, CAPE, CIN, vertical wind shear, perturbation temperature (cold pool),  helicity, etc., can be derived, essential for characterizing and predicting convective storms. These diagnostic fields provide depictions of the mesoscale  environment, the triggering mechanism, and the structure of convective storms. Some of these fields are being used in AutoNowcaster to identify regions of convective initiation.

NOWCASTING WIND & PRECIPITATION

The  analysis fields produced by FINECAST® are also used to initialize Numerical Weather Prediction (NWP) models to improve precipitation and wind nowcasts. FINECAST® analyses are initial conditions for the cloud model used in FINECAST® that constrain the 4DVar analyses, from which nowcasts can be launched by directly integrating the cloud model. FINECAST® analyses  have also been used to initialize other non-hydrostatic models, such as WRF (Weather Research and Forecasting). 

FINECAST® is being studied for its ability to address the challenges of nowcasting wind-ramp events in hopes of improving wind-power prediction. Research is also being conducted to evaluate FINECAST®’s skill in nowcasting convective precipitation. Our goal  is to expand FINECAST® into a new generation of nowcasting system that is model-based and initialized by assimilating multiple platforms of high-resolution observations producing rapidly updated nowcasts every 10 minutes or less.

ONGOING & FUTURE DEVELOPMENT 

The capability of FINECAST® has expanded to include terrain effects. Recent studies demonstrate that the IBM terrain scheme is capable of simulating the updraft/downdraft and associated precipitations caused by complex terrain. Assimilating polarimetric radar observations is another research activity with the potential to improve the accuracy of FINECAST® analyses and nowcasts. Through an upcoming collaborative project, FINECAST® will be implemented with a high-resolution (~250m) configuration to assimilate both radar and lidar observations for airports.

To order FINECAST® contact: 

info@ral.ucar.edu
303.497.8422

Contact

Please direct questions/comments about this page to:

Jenny Sun

Senior Scientist

email

Juneau Airport Wind System (JAWS)

Juneau Airport Wind System (JAWS)
The above photo shows the Juneau International Airport and Gastineau Channel. The patches of churning water seen in multiple areas of the channel give an indication of the strength of the northerly wind conditions and turbulence that planes can expect to encounter when flying along the waterway. (Photo credit: John "Jack" Hermle).

Forget the stunning in-flight views of rugged mountains and nearby ocean. What proves more memorable to many pilots and passengers flying into Juneau's International Airport is the turbulence felt during approach and departure. Pilots landing and departing from Juneau, Alaska face some of the nation's most challenging navigational conditions, and the airport has a history of turbulence-related incidents involving passenger jets. In the aftermath of a 737 aircraft nearly being lost upon encountering severe turbulence, the Federal Aviation Administration (FAA) imposed restrictive rules of operation that were to be maintained until a new warning system could be developed for the airport.

Map of NCAR anemometer and wind profiler locations.

Juneau's turbulence issues largely stem from the effects of surrounding mountainous terrain on wind-flow patterns. The airport's single runway sits at the end of the Gastineau Channel. Surrounded by steeply rising mountains, winds streaming into and over the narrow channel tend to be complex. JAWS Prototype graphical display. Click to enlarge. JAWS Prototype graphical display. Under certain conditions, the combination of wind speed and direction means that turbulence is too strong for commercial jets to land or take off from Juneau.

Sheep Mountain tower is one of the mountaintop sites that collects wind and temperature information that is used to decide whether turbulence is present in the area. As can be noted from the rime ice accumulation on the tower, operation and maintenance of the JAWS system is often challenging because of harsh environmental conditions. To better warn pilots of potentially dangerous turbulence, the FAA and Juneau airport officials turned to NCAR's Research Applications Laboratory (RAL) for a solution. RAL scientists had previously designed the software used in the turbulence alerting system developed for Hong Kong's International Airport, which has turbulence issues similar to Juneau's. The FAA asked RAL scientists to create a similar, prototype system for Juneau.

Juneau has two strong wind regimes — one stemming from the north, the other from the southeast. Northerly winds are generated by pressure and/or temperature gradients between the Canadian interior and Alaska's southeast coastal regions. The southeasterly winds tend to be most prevalent and also the most problematic for the area. Southeasterly winds spawn from a variety of sources. Low pressure systems that generate storms in the Gulf of Alaska are often drivers of these winds. In addition, surface-level winds coursing up the Inland Passage can gain considerable steam because of funneling effects, while winds aloft often end up swinging in a southerly or southwesterly direction.

Because the airport provides the only non-waterway entry into and out of the city, air traffic tends to be heavy, averaging more than 400 flights daily. Additionally, with the city's economy largely tied to tourism, government-related work, and retail sales, safe, reliable air transit is critical. However, the northerly and southeasterly wind regimes led to enough passenger jet and private aircraft turbulence-related incidents that Mark Air and Delta Airlines stopped serving Juneau. Alaska Airlines remains as the only commercial air carrier serving the city.

JAWS Prototype graphical display

Unlike the Hong Kong project, in which RAL provided only the alert-system software, the plan for Juneau included responsibilities for creating the prototype in its entirety. This expanded role meant that the team would have to identify best placement of weather profiling stations in order to pinpoint areas of greatest turbulence, then design, build and maintain the sensor sites that provided information about wind speed, wind direction, air temperature, etc. Initially, RAL purchased equipment that Alaska Airlines installed and used to enhance flight safety. Then, from this initial equipment suite, RAL expanded monitoring to include additional sites and new types of hardware, including wind profilers.

Today, five anemometer sites and three wind profiler sites supply data to the prototype Juneau Airport Winds System (JAWS). Each site is found at a strategically located position to capture critical information on the northerly and southeasterly wind regimes from surface level to 6,000 feet. Data is fed from these sites to a central location at the airport where it is processed and alert information is generated.

The weather sensors at each site route data through a network of wireless radios and telephone lines. Using this information, JAWS generates turbulence alerts every minute for hazardous areas in the vicinity of the airport. These alerts give pilots real-time information about wind speed, wind direction, and an indication of overall flight safety. While the output is designed for use by pilots flying 737 jets, the color-coded alerts (yellow for moderate, and red for severe) are useful to pilots of smaller planes who can assess flight safety level based on how their aircraft compares to a 737's size and capabilities.

Begun in 1997, JAWS evolved greatly over the past decade, steadily improving and refining system capabilities with the goals of increased flight operational safety and alert system availability, meeting the needs of pilots, flight service specialists, and the flying public, and ensuring that a repeat of past significant encounters with turbulence no longer occur. By FY2007 a JAWS prototype, tested and validated by the FAA, was operating with alerts. Shortly thereafter the FAA commenced development of its own "end-state" (JAWS-E) version of the system. The FAA development strategy included incorporation of NCAR's algorithms, display technology, and most remote site hardware. In FY2010 maintenance of the mountaintop sites transitioned to the FAA, followed by wind profiler site maintenance in FY2011. In early FY2012 the FAA commenced an Operational Readiness Demonstration of their system, following which they commenced formal operation of JAWS-E. At this time parallel operation of the NCAR prototype ceased, the prototype was shut down and dismantled. Formal commissioning of the JAWS-E occurs in July 2012, following which Alaska Airlines, the only part 121 commercial carrier operating in Juneau, will change their Operations Specification to use JAWS alerts for making go/no go decisions at the Juneau International Airport.

Now that the JAWS program is completed, consideration could be focused on using JAWS-like systems at airports around the United States experiencing similar terrain–influenced turbulence. Pilots flying into and out of airports located in Maui, Reno, and Las Vegas, and other sites in Alaska, for example, could benefit from JAWS technology, and new prototypes would benefit from lessons learned during the Juneau alert system's development and maintenance.

Funding

Federal Aviation Administration (FAA)

Contact

Please direct questions/comments about this page to:

Scott Landolt

Director, Transportation Meteorology Applications Program

email

Arnaud Dumont

Deputy Director Engineering, Aviation Applications Program

email