DART is created by the Data Assimilation Research Section (DAReS), a small group of data assimilation experts, software engineers and physical scientists. DAReS was founded as the result of NCAR's Data Assimilation Initiative, a collaborative process that gauged the needs of researchers across NCAR. The initiative established the necessity of developing methodologies, tools and software to enable data assimilation capabilities within models developed at NCAR.
DAReS staff serve projects at NCAR and within the university community by providing a bridge between teams with existing observational and modeling expertise. This aids model development by describing model error and enables fundamental discoveries by allowing observationalists and modelers to share their expertise by combining models and data using a rigorous assimilation framework.
In the years since DAReS’ founding, DART has grown beyond its original purpose and now supports data assimilation in models developed at NCAR and by the broader geosciences community. DAReS staff have expertise in algorithm development, software design, software portability, large-model implementation and execution, observations and observation operators.
Extreme heat is a leading cause of weather-related human mortality in the United States and in many countries world-wide. Despite the advances in meteorological forecasting capabilities and the widespread prevalence of air conditioning systems across the U.S., extreme heat persists as a threat to human health. As global warming patterns continue, researchers anticipate increases in the severity, frequency and duration of extreme heat events. Recent studies on climate impacts demonstrate that climate change will have differential consequences in the U.S. at the regional and local scales. Research priorities in public health and climate change science communities call for addressing the current impacts of weather hazards on human health, and for preparing for future risks and threats in a warmer climate. The SIMMER project addresses the critical need for information at regional to local scales that are pertinent to public health decision-making in the context of global change.
The primary goals of the SIMMER project are to: 1) advance methodology for assessing current and future urban vulnerability from heat waves through integration of physical and social science models, research results, and NASA data; and 2) develop a System for Integrated Modeling of Metropolitan Extreme Heat Risk (SIMMER) for building local capacity for heat hazard mitigation and climate change adaptation in the public health sector. The study includes the following objectives:
Determining the combined impact of extreme heat and the characteristics of urban environmental and social systems on human health;
Characterizing societal vulnerability and the responses (i.e., mitigation and adaptation strategies);
Improving representation of urban land cover and its accompanying radiative and thermal characteristics at local and regional scales;
Characterizing and modeling present and future extreme heat events at regional and local scales.
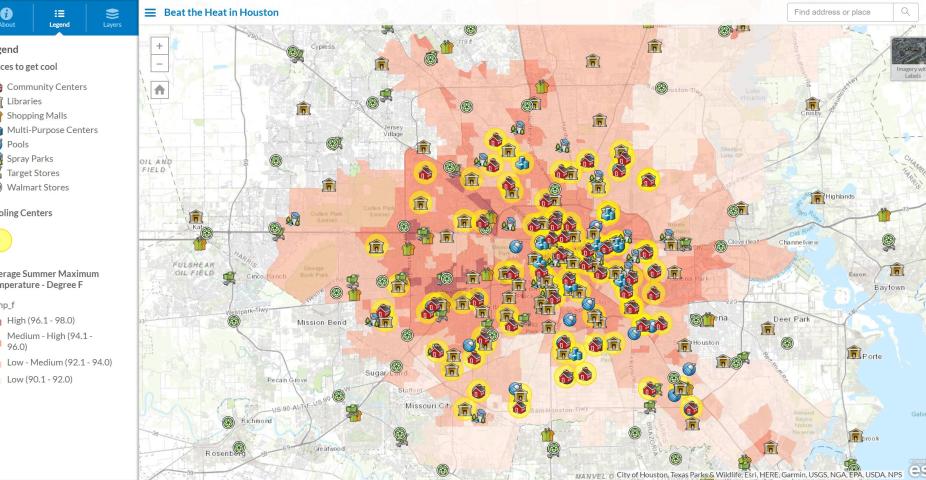
The SIMMER will rely heavily on the use of NASA Earth Science products and will directly support NASA’s objective to promote interdisciplinary research that addresses societal impacts of extreme disturbances. NASA data will be used as inputs into health and climate models, will contribute to creation of new regional and local datasets and innovative research results, and will help validate model outputs. The project will include regional- and local scale analyses. The regional-scale analysis (the study domain will cover the contiguous United States and portions of southern Canada at ~ 25 km2) will focus on the SIMMER objectives 3 and 4. Local, intra-urban scale (1-2 km2; US Census block groups) will focus on the SIMMER objectives 1-4. Houston, Texas will be used for local-scale analysis and will serve as testbed for developing and implementing the SIMMER methodology. We selected Houston as a case study because of the city’s current and projected heat-related health impacts, complex local meteorology and land use types, diverse socio-economic makeup of urban residents, previously-conducted research on the UHI effects, and a strong interest from Houston public health officials in this project.
The methodology developed for Houston is intended to be transferrable to other urban centers. The robustness of the method and its transferability will be validated in Toronto, Canada. With the help of Canadian collaborators we will apply and validate the SIMMER model in assessing heat-related health risks and social vulnerability in Toronto. In addition, involvement of public health sector stakeholders from Houston and Toronto will ensure that relevant application(s) for the model in the context of climate change and human health are included. Involvement of university collaborators and students will facilitate training of current and future researchers in the integration of the physical and social sciences.
The WRF-Solar® model (Jimenez et al. 2016) is a specific configuration and augmentation of the Weather Research and Forecasting (WRF) model. Previous efforts have been largely devoted to enhance the aerosol-cloud-radiation physics. To extend the WRF-Solar capabilities beyond deterministic forecasts, we are developing the WRF-Solar Ensemble Prediction System (WRF-Solar EPS).
WRF-Solar EPS introduces stochastic perturbations in the most relevant variables for solar irradiance forecasts. The variables have been identified with tangent linear models of selected parameterizations (Yang et al. 2020). The model provides a user-friendly configuration to set the characteristics of the perturbations for each variable (in an ascii configuration file) and to select the variables to perturb (in the WRF namelist).
Global horizontal irradiance forecast as a function of the lead time: thin lines) WRF-Solar EPS ensemble members, thicker line) ensemble mean. Observations are also shown (shaded).
References
Jimenez, P. A., J. P. Hacker, J. Dudhia, S. E. Haupt, J. A. Ruiz-Arias, C. A. Gueymard, G. Thompson, T. Eidhammer and A. Deng, 2016a: WRF-Solar: Description and Clear-Sky Assessment of an Augmented NWP Model for Solar Power Prediction. Bull. Amer. Met. Soc., 97, 1249-1264. doi:10.1175/BAMS-D-14-00279.1
Yang, J., J. H. Kim, P. A. Jimenez, M. Sengupta, J. Dudhia, Y. Xie, A. Golnas and R. Giering, 2020: An efficient method to identify uncertainties of WRF-Solar variables in forecasting solar irradiance using a tangent linear sensitivity analysis. Solar Energy (In press)
Description
The variables to perturb were identified using six parameterizations responsible for radiation and cloud formation and dissipation:
Thompson microphysics (Thompson et al. 2008)
Mellor–Yamada–Nakanishi–Niino (MYNN; Nakanishi and Niino 2009) planetary boundary layer (PBL)
Noah surface model (Noah LSM; Chen and Dudhia 2001)
Deng shallow cumulus system (Deng et al. 2014, Jimenez et al. 2016)
Fast-All-sky Radiation Model (FARMS) radiation (Xie et al. , 2016)
A parameterization of the unresolved clouds module based on relative humidity (CLD3)
The most relevant input variables for each module were selected using tangential linear analysis. With this aim, we developed tangent linear models (TLM) for each of the selected modules. The TLMs were used to analyze uncertainties of the output variables to uncertainties in the input variables in order to select the most sensitive variables controlling radiative transfer and cloud processes. We identified 14 variables (Yang et al. 2020): surface albedo, aerosol optical depth, Ångström exponent, asymmetry factor, water vapor mixing ratio, cloud/ice/snow mixing ratios, ice number concentration, potential temperature, turbulent kinetic energy, soil moisture content, soil temperature, and vertical velocity. Table 1 shows a complete list of these variables (column 2) and their associated parameterizations (column 3).
Table 1 also shows the characteristics of the stochastic perturbations (columns, 4, 5 and 6). The perturbations are obtained through sampling an isotropic Gaussian distribution. The perturbations are characterized by the standard deviation of the Gaussian distribution (σ, column 4), the wavelength (λ, column 5), and the decorrelation time (τ, column 6) between consecutive perturbations (Berner et al. 2009 and Jankov et al. 2017). WRF-Solar EPS adds the stochastic perturbations inside each parameterization every model time step.
Table 1. Characteristics of the 14 stochastic perturbations in WRF-Solar EPS.
References
Berner, J., G. Shutts, M. Leutbecher, and T. Palmer, 2009: A spectral stochastic kinetic energy backscatter scheme and its impact on flow-dependent predictability in the ECMWF en- semble prediction system. J. Atmos. Sci., 66, 603–626.
Chen, F., and J. Dudhia, 2001: Coupling an advanced land surface-hydrology model with the Penn State-NCAR MM5 modeling system. Part I: Model implementation and sensitivity, Mon. Weather Rev.,129, 569–585.
Deng, A., B. J. Gaudet, J. Dudhia, and K. Alapaty, 2014: Implementation and evaluation of a new shallow convection scheme in WRF. 26th Conf. on Weather Analysis and Forecasting/22nd Conf. on Numerical Weather Prediction, Atlanta, GA, Amer. Meteor. Soc., 12.5. [Available online at https:// ams.confex.com/ams/94Annual/webprogram/Paper236925.html.]
Jankov, I., and Coauthors, 2017: A performance comparison between multiphysics and stochastic approaches within a North American RAP ensemble. Mon. Wea. Rev., 145, 1161–1179.
Jimenez, P.A., S. Alessandrini, S. E. Haupt, A. Deng, B. Kosovic, J. A. Lee, L. Delle Monache, 2016: The role of unresolved clouds on short-range global horizontal irradiance predictability. Mon. Wea. Rev., 144, 3099 - 3107. doi:10.1175/MWR-D-16-0104.1.
Nakanishi, M., and H. Niino, 2009: Development of an improved turbulence closure model for the atmospheric boundary layer. J. Meteor. Soc. Japan, 87, 895–912.
Thompson, G., P. R. Field, R. M. Rasmussen, and W. D. Hall, 2008: Explicit forecasts of winter precipitation using an improved bulk mi- crophysics scheme. Part II: Implementation of a new snow parameterization. Mon. Wea. Rev., 136, 5095–5115.
Xie, Y., M. Sengupta, and J. Dudhia, 2016: A Fast All-sky Radiation Model for Solar applications (FARMS): Algorithm and performance evaluation. Sol. Energy, 135, 435-445.
Yang, J., J. H. Kim, P. A. Jimenez, M. Sengupta, J. Dudhia, Y. Xie, A. Golnas and R. Giering, 2020: An efficient method to identify uncertainties of WRF-Solar variables in forecasting solar irradiance using a tangent linear sensitivity analysis. Solar Energy (In press.)
User's guide
WRF-Solar EPS requires to describe the characteristic of the stochastic perturbations for each variable and to select the variables to perturb. These two steps are summarized as follows:
The STOCHPERT.TBL file in the run directory is used to set the characteristics of the perturbations. The file has one row for each variable (14 variables). The columns correspond to the variable number, the standard deviation of the perturbation (in %), the wave length (in meters), the decorrelation time (in seconds), the maximum value of standard deviations allowed in the amplitude of the perturbation, the random seed used to generate the sequence of random numbers, and the dimension of each variables (0 for 2D, and 1 for 3D)
The ‘$stoch’ block in the WRF namelist is used to set the variables to perturb. Setting ‘multi_perturb’ to 1 activates the perturbations. The variable ‘nens’ is the # of the ensemble member and determines the random number sequence in the simulation. The user also needs to select which parameterization (logical flag) and which variables (0.0 off and 1.0 on), will be perturbed. The example below activates the perturbations in all variables of all parameterizations except for CLD3.
Publications
Yang, J., J.H. Kim, P.A. Jimenez, M. Sengupta, J. Dudhia, Y. Xie, A. Golnas and R. Giering, 2020: An efficient method to identify uncertainties of WRF-Solar variables in forecasting solar irradiance using a tangent linear sensitivity analysis. Solar Energy (In press.)
NCAR developed an enhanced version of the Weather Research and Forecasting model – WRF-Solar® model to improve forecasting of solar irradiance at the surface in hour-ahead to day-ahead range for renewable energy applications. WRF-Solar was the first numerical weather prediction (NWP) model specifically designed to meet the growing demand for specialized numerical forecast products for solar power applications. Specific developments included addition of direct normal irradiance and diffuse irradiance components to the model output, a fast radiative transfer code, new parameterization that improves representation of absorption and scattering by aerosols, accounting for aerosol interactions with cloud microphysics, as well as implementation of an improved shallow cumulus parameterization. While these developments resulted in significant improvements in short-range and day-ahead forecasts for both clear sky and cloudy conditions there are several areas where further improvement could result in significant error reduction in predicted solar irradiance.
The goal of this project is to reduce forecast errors of global horizontal irradiance and direct normal irradiance and to yield better forecasts of irradiance ramps, improvements in estimates of sub-grid scale variability, and more accurate estimates of forecast uncertainty. WRF-Solar V2 will include a number of enhancements including:
New representation of boundary-layer clouds (both shallow cumuli and the breakup of stratocumulus) including the impact of entrainment on cloud fraction in a grid cell.
Improved treatment of cloud microphysics, and impacts of aerosol (including black carbon),
New parameterizations to account for the sub-grid temporal variability of solar irradiance during periods with broken clouds, and
Detailed analysis to better quantify model uncertainty and improved calibration of WRFSolar V2 using Uncertainty Quantification (UQ) techniques.
With these improvements, WRF-Solar V2 will be a new tool that will lead to improved intra-day and day ahead forecasts. The new version of WRF-Solar will be a community model that will become the new standard in irradiance forecasts.
Haupt, S. E., B. Kosovic, T. Jensen, J. K. Lazo, J. A. Lee, P. A. Jiménez, J. Cowie, G. Wiener, T. C. McCandless, M. Rogers, S. Miller, M. Sengupta, Y. Xie, L. Hinkelman, P. Kalb, and J. Heiser, 2018: Building the Sun4Cast system: Improvements in solar power forecasting. Bull. Amer. Meteor. Soc.99, 121-135, https://doi.org/10.1175/BAMS-D-16-0221.1.
Jiménez, P. A., J. P. Hacker, J. Dudhia, S. E. Haupt, J. A. Ruiz-Arias, C. A. Gueymard, G. Thompson, T. Eidhammer and A. Deng, 2016: WRF-Solar: Description and clear-sky assessment of an augmented NWP model for solar power prediction. Bull. Amer. Meteor. Soc., 97, 1249-1264, https://doi.org/10.1175/BAMS-D-14-00279.1.
A solar irradiance nowcasting system to support the Group on Earth Observations (GEO) Vision for Energy
A GEO Vision for Energy (GEO-VENER) goal includes “the availability and long-term acquisition of data from satellite and in-situ instruments and models to make possible the effective deployment, operation and maintenance of renewable energy systems and their integration in the grid.” The challenge for renewable energy systems is managing the high spatial and temporal variability of renewable resources. The adverse effects of this high variability in energy production can be mitigated via accurate predictions of the renewable resources (e.g. solar irradiance).
Schematic diagram illustrating the current performance of WRF-Solar® and MADCast in the first six hours of forecast (blue and red solid lines), their expected performance after the improvements introduced in this project (dashed lines) and the expected performance of MAD-WRF (gren solid line).
Short-term predictions of up to a few hours (i.e. nowcasting) of solar irradiance are already being used to manage renewable systems. Nowcasting systems help operators ensure grid stability and power plant performance. Standard nowcasting methodologies include the use of retrievals from earth observing satellites to detect and advance the clouds (e.g. Lee et al. 2017). This methodology faces limitations when clouds grow or decay, or they are anchored to various terrain features. Full cloud processes are better represented in numerical weather prediction (NWP) models. However, nowcasting systems based on NWP models do not always include accurate satellite-based cloud initialization.
To overcome the limitations of current solar irradiance nowcasting systems we are blending a satellite- based initialization system with a NWP-based nowcasting approach to create an improved end-to-end solar irradiance forecast system, called MAD-WRF. The development of MAD-WRF forms part of the National Aeronautics and Space Administration (NASA) Earth Science Division (ESD) efforts to advance specific elements of the GEO Work Programme 2017-2019 through the Applied Science Program (ASP).
MAD-WRF will blend two nowcasting systems. The Multi-sensor Advection Diffusion nowCast (MADCast) version 2 (Xu et al. 2016) assimilates infrared profiles from instruments on board different satellites (GOES, MODIS, AIRS, etc.) using a particle filter to infer the presence of clouds. This three-dimensional (3D) cloud field is subsequently advected and diffused by a modified version of the Weather Research and Forecasting (WRF, Skamarock et al. 2008) NWP model that produces the solar irradiance forecast. The second nowcasting system is based on WRF with extensions for solar energy applications (WRF-Solar®, Jimenez et al. 2016). Our results running both models indicate that MADCast typically produces superior performance than WRF- Solar at the beginning of the simulated period. This is due to the improved satellite-based cloud analysis. However, after an hour or two into the forecast, the improved physics of WRF-Solar® provides the superior solar irradiance forecast. Blending the two systems in MAD-WRF will provide a prediction system with the strengths of both nowcasting methods. Figure 1 shows a conceptual diagram illustrating the performance of MADCast, WRF-Solar® and the expected performance of MAD-WRF. An initial exploration of the viability of MAD-WRF showed promising results (Haupt et al. 2018).
The improved nowcasts from MAD-WRF will help achieve GEO-VENER goals of making possible the effective deployment, operation and maintenance of renewable energy systems and their integration in the grid. MAD-WRF will be publicly available to help achieve GEO-VENER goals beyond this project.
Haupt, S. E., B. Kosovic, T. Jensen, J. K. Lazo, J. A. Lee, P. A. Jiménez, J. Cowie, G. Wiener, T. C. McCandless, M. Rogers, S. Miller, M. Sengupta, Y. Xie, L. Hinkelman, P. Kalb, and J. Heiser, 2018: Building the Sun4Cast system: Improvements in solar power forecasting. Bull. Amer. Meteor. Soc.99, 121-135, https://doi.org/10.1175/BAMS-D-16-0221.1.
Jiménez, P. A., J. P. Hacker, J. Dudhia, S. E. Haupt, J. A. Ruiz-Arias, C. A. Gueymard, G. Thompson, T. Eidhammer and A. Deng, 2016: WRF-Solar: Description and clear-sky assessment of an augmented NWP model for solar power prediction. Bull. Amer. Meteor. Soc., 97, 1249-1264, https://doi.org/10.1175/BAMS-D-14-00279.1.
Lee, J. A., S. E. Haupt, P. A. Jiménez, M. A. Rogers, S. D. Miller, and T.C. McCandless, 2017: Solar irradiance nowcasting case studies near Sacramento. J. Appl. Meteor. Climatol., 56, 85-108, https://doi.org/10.1175/JAMC-D-16-0183.1.
Skamarock, W. C., J. B. Klemp, J. Dudhia, D. O. Gill, D. M. Baker, M. G. Duda, X.-Y. Huang, W. Wang, and J. G. Powers, 2008: A description of the Advanced Research WRF version 3. NCAR Tech. Note NCAR/TN-475+STR, 113 pp., https://doi.org/10.5065/D68S4MVH.
Xu, D., T. Auligné, G. Descombes, and C. Snyder, 2016: A method for retrieving clouds with satellite infrared radiances using the particle filter. Geosci. Model Dev., 9, 3919-3932, https://doi.org/10.5194/gmd-9-3919-2016.
McCandless, T., and P.A. Jimenez, 2020: Examining the potential of a random forest derived cloud mask from GOES-R satellites to improve solar irradiance forecasting. Energies, 13, 1671. Open access article available online at https://www.mdpi.com/1996-1073/13/7/1671
Jimenez, P.A., 2020: Assessment of the GOES-16 clear sky mask product over the Contiguous U.S. using CALIPSO retrievals. Remote Sens.2020, 12, 1630. Open access article available online at https://www.mdpi.com/2072-4292/12/10/1630
Contact
Please direct questions/comments about this page to:
Figure 1. Gerry Wiener, Branko Kosovic, Sue Ellen Haupt, and Jared Lee at the 10-MW PV solar plant at the Shagaya Renewable Energy Park for its Grand Opening on 20 Feb 2019.
The ultimate goal of this project is to deliver to KISR an operational wind and solar power forecasting system, for both nowcasting and day-ahead time horizons (and beyond), with which they can provide forecasts to their national power grid operators and wind/solar power plant operators. The forecasting system is called the Kuwait Renewable Energy Prediction System (KREPS).
Kuwait has a stated national goal of 15% renewable energy generation by 2030, and to that end has established the Shagaya Renewable Energy Park in the desert about 100 km west of Kuwait City. Phase 1 of Shagaya is now complete, with demonstration-scale 10-MW photovoltaic (PV) solar (Figure 1) and 10-MW wind plants (Figure 2) that were commissioned in May 2017, and a 50-MW concentrated solar power (CSP) plant (Figure 3) that was commissioned in December 2018. The official Grand Opening for the Shagaya Renewable Energy Park was held in February 2019.
Figure 2. Four of the five wind turbines of the 10-MW wind plant at the Shagaya Renewable Energy Park in western Kuwait.
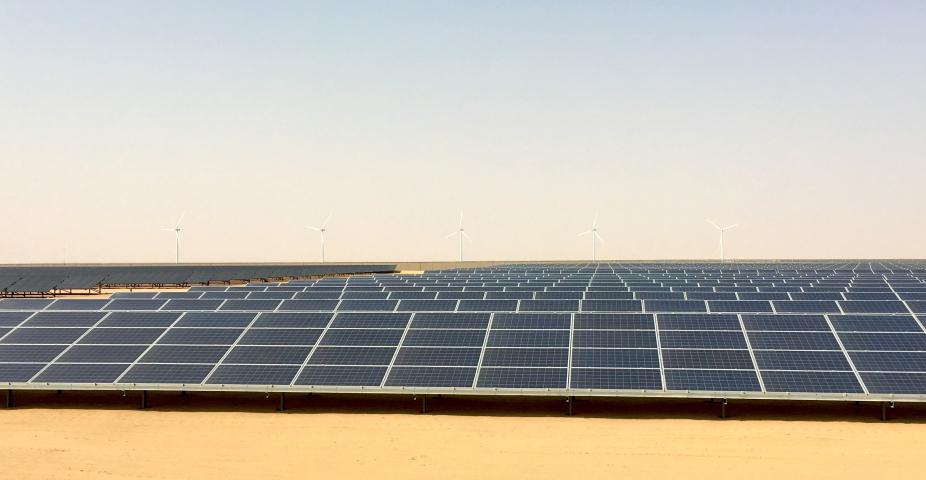
Phase 2 of Shagaya will include a 1500-MW PV solar plant, which will be the second-largest PV plant in the world. Construction of this 1500-MW al-Dibdibah PV plant at Shagaya is hoped to begin late in 2019 or in 2020, with completion expected after the end of NCAR’s initial 3-year project. Additional wind, PV solar, and CSP solar capacity is planned beyond that in Phases 2 and 3 of Shagaya, with a goal of 3–5 GW of combined wind and solar power installed capacity at Shagaya by 2030. We hope to continue our partnership with KISR to grow and improve KREPS as more renewables come online in Kuwait.
Figure 3. Part of the 50-MW concentrated solar power (CSP) plant at the Shagaya Renewable Energy Park in western Kuwait, with the new KISR research facility and the wind turbines in the background.
The NCAR team, in collaboration with researchers from Penn State University and Solar Consulting Services, has been building various aspects of KREPS, leveraging advancements made on several past and current renewable energy forecasting projects in RAL, and developing new and improved techniques and products with pioneering research. Key components of the fully engineered system include high-resolution WRF-Solar® forecasts, a newly developed blend of WRF with MADCast (MAD-WRF) to improve cloud initialization for nowcasting, NCAR's DICast® system that produces dynamically blended and tuned forecast for the various sites, an analog ensemble (AnEn) implementation to quantify the uncertainty in the forecasts, and the StatCast-Solar and StatCast-Wind models that use machine learning techniques and recent real-time observations to generate nowcasts. A Display system to show operators and researchers the past and present performance of KREPS has also been developed. Assessment and development of the system and its components are ongoing, and KREPS will be transferred to KISR by the scheduled end of the project in summer 2020.
Several conference presentations and journal papers have already been submitted that stem from research accomplished on this project (click on the Resources tab to see a list of these references), and many more are planned through 2019 and 2020.
REFERENCES
Alessandrini, S., S. Sperati, and L. Delle Monache, 2019: Improving the analog ensemble wind speed forecasts for rare events. Mon. Wea. Rev., conditionally accepted and in revision.
Al-Rasheedi, M., C. A. Gueymard, A. Ismail, and T. Hussain, 2018: Comparison of two sensor technologies for solar irradiance measurement in a desert environment. Sol. Energy, 161, 194–206, https://doi.org/10.1016/j.solener.2017.12.058.
Brummet, T., J. A. Lee, and G. Wiener, 2019: The relationship between GHI and power in Kuwait. 10th Conf. on Weather, Climate, and the New Energy Economy/18th Conf. on Artificial and Computational Intelligence and its Applications to the Environmental Sciences. Phoenix, AZ, Amer. Meteor. Soc., J3.4, https://ams.confex.com/ams/2019Annual/meetingapp.cgi/Paper/350578.
Gueymard, C. A., and P. A. Jiménez, 2018: Validation of real-time solar irradiance simulations over Kuwait using WRF-Solar. 12th Int. Conf. on Solar Energy for Buildings and Industry (EuroSun 2018). Rapperswill, Switzerland, Int. Solar Energy Soc., 2.A-1, https://doi.org/10.18086/eurosun2018.09.14.
McCandless, T. C., and S. E. Haupt, 2019: The super-turbine wind power conversion paradox: Using machine learning to reduce errors caused by Jensen’s Inequality. Wind Energy Sci. Discuss., in review, https://doi.org/10.5194/wes-2018-74.
Naegele, S. M.,T.C. McCandless, S. E. Haupt, G. S. Young, and S. J. Greybush, 2019: Climatology of Wind Energy Variability for the Kuwait Region. 10th Conf. on Weather, Climate, and the New Energy Economy/18th Conf. on Artificial and Computational Intelligence and its Applications to the Environmental Sciences. Phoenix, AZ, Amer. Meteor. Soc., 10.2, https://ams.confex.com/ams/2019Annual/meetingapp.cgi/Paper/352390.
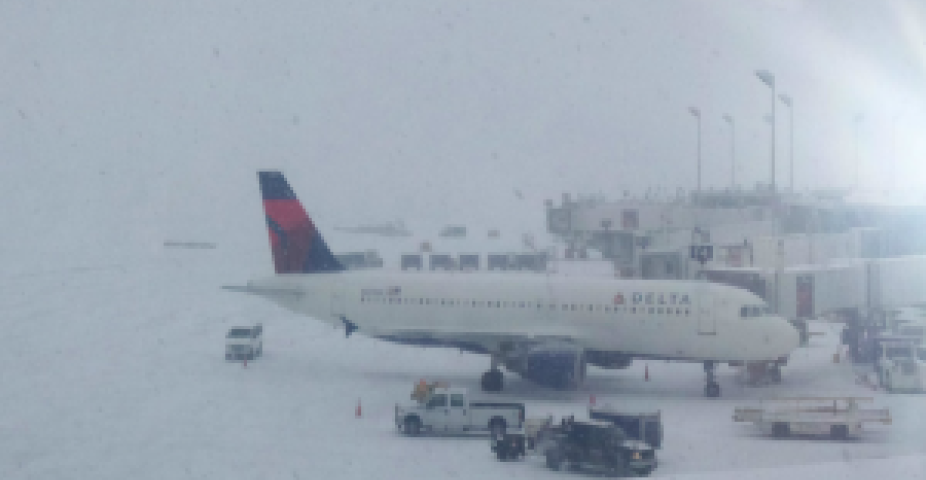
It’s well known that adverse winter weather can significantly disrupt airport operations. Snow and ice buildup on the runways reduces the pavement friction and can cause airplanes to slide upon landing or takeoff. When the surface friction falls below certain levels, runways must be closed in order to keep planes safe. The safety and efficiency of airport and flight operations hinges on timely and accurate weather forecasts that can also give an indication as to when the runway friction is reduced to the point where runways must be closed. Therefore, having an accurate forecast of runway friction can help airport managers make better decisions on when and how long to close runways.
Example Output: Multi-Panel Plot
Example Runway Closure Matrix
Until recently, the airport community has relied on conventional methods for acquiring and applying weather-related runway friction information in the runway closure decision process usually from multiple sources. Minneapolis–Saint Paul International Airport (MSP) experiences several winter storms each season where the runways must be closed due to a loss of runway friction. As a result, MSP contacted the National Center for Atmospheric Research (NCAR) for help in automating the procedure for recording and relating friction observations to runway closure times. NCAR entered into a contract with MSP in the fall of 2017 to develop an initial Runway Friction and Closure Prediction System (RFCPS). The system provides a forecast of runway friction values and runway closure alerts from 0 to 6 hours at 15-minute temporal resolution.
The initial RFCPS prototype system relies on data processing and machine learning techniques developed at NCAR. The RFCPS uses a backend forecast engine combined with machine learning modules and rules of practice to predict runway friction and runway closures alerts. The friction values are combined with rules of practice to predict runway closure alerts. The RFCPS technology can be applied at any airport that has runway frictions issues during adverse winter weather. For example, NCAR will also be working with Denver International Airport (DEN) over the next several years to develop a runway friction prediction system at the airport.
MSP Airport during winter
The initial RFCPS predicts runway friction values out to 6 hours at 15-minute lead-times. The system currently updates every hour but will be modified to update sub-hourly considering the latest runway friction measurements (observations). The system provides output in several formats: a pdf containing multi-panel forecast plots for each 1/3 segment along a runway; a combined csv file that contains the same forecast data that goes into the pdf multi-panel plots, but in comma separated text format; and lastly a runway closure guidance matrix, which shows friction values and closure alerts for each runway segment in a grid displaying forecast lead-times (a quick way to show when a runway closure is most likely and on what runway).
Contact
Please direct questions/comments about this page to:
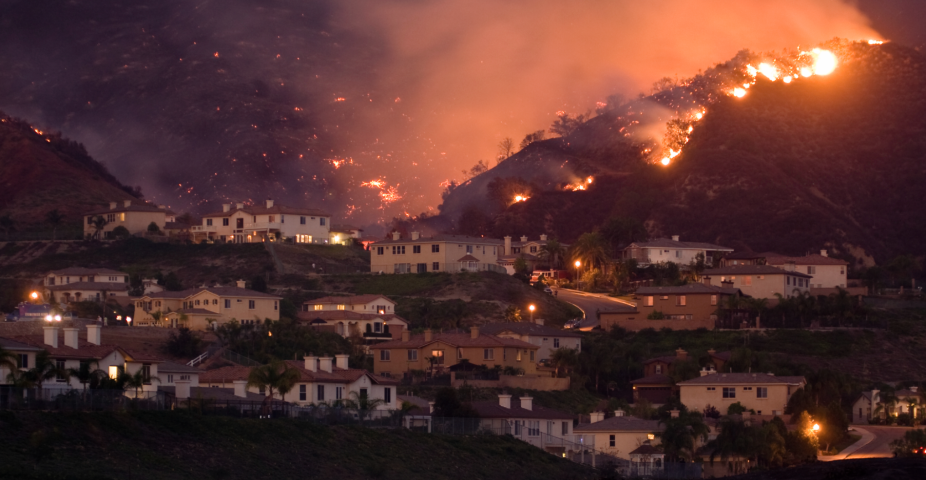
The CO-FPS project is a five-year effort funded by the State of Colorado with the goal of designing, building, and transferring to the state a cutting-edge system for predicting a wildfire’s extent and rate of spread; the heat and smoke it generates; the wind, temperature, and humidity in the fire’s immediate environment; and aviation hazards around the fire.
The project began in 2015 with a bill signed into law by Governor John Hickenlooper. The state manages the project through its Center of Excellence for Advanced Technology Aerial Firefighting (CoE).
The core predictive technology in CO-FPS is based on NCAR’s coupled atmosphere wildland fire prediction system, which uses the Weather Research and Forecasting WRF-Fire model for simulating weather, and a fire-prediction module for simulating a fire’s behavior, fuels, local atmospheric conditions, and the effects those conditions have on fuel moisture.
The Federal Aviation Administration (FAA) Weather Observation Improvements (WOI) program manages the evolution of the existing aviation weather observation sensor network to one that provides the optimal quantity and quality of ground, air, and space-based sensors. Of primary focus is the surface weather sensor network in the airport terminal environment. Accurate knowledge of airport weather conditions is critically important for aircraft and airline operations (e.g., determining aircraft deicing holdover times as well as takeoff and landing performance calculations) and airport traffic management (e.g., selection of appropriate runways and estimating airport arrival and departure capacity). The nation’s current ground-based airport weather observation architecture has evolved over decades in different ways at different airports, leading to inconsistencies and shortfalls in airport weather sensing and data dissemination. The purpose of the information provided on this page is to provide visual examples of the different types of winter precipitation that can be encountered at airports around the country.
The Automated Surface Observing System (ASOS)/Automated Weather Observing System (AWOS) primarily serve as the source on-airport sensor and algorithmically determine a precipitation type and intensity. The precipitation type sensor on the ASOS has reached its end of life and the latest generation of present weather sensors must be tested to determine their capabilities for correctly identifying and reporting the types of precipitation that are occurring. To do this, high resolution video cameras have been collocated with the new sensors to record the various weather conditions for later comparison to the sensor data. Examples of the different types of precipitation recorded by the cameras are shown below, which would be used for comparison against the sensor data.
Any observations of snowfall require an aircraft undergo deicing operations. Light and moderate intensity snow (-SN, SN) have holdover times (HOTs) that tell pilots and ground deicing crews how long their anti-icing fluids will last under the given conditions. Heavy snow (+SN), which occurs in conditions where the visibility drops below 5/8 of a mile or the liquid water equivalent of the falling snow is greater than 0.1 inches per hour, has no holdover times and often results in an airport shutting down in more extreme conditions. Snowfall of any amount can also have impacts on runway plowing operations, which can reduce the number of takeoffs and landings due to runway closures while plowing and and chemical application operations are occurring.
SNOW BEGINS
Dry Target
Look for multiple opaque flakes/pellets on the target (Day/Night)
Speed slide video to determine good start time (D/N)
Wet Target
Look for opaque flakes/pellets on target (D/N)
Speed slide video to determine good start time (D/N)
Wide views reduction in visibility (D/N)
Note: Floating motion (D/N)
Pellets that are opaque slightly bounce and roll (D/N)
Note: Shows up much brighter than rain (D/N)
SNOW INCREASING
More opaque pellets/flakes accumulate on target/ground (D/N)
Wide view visibility drop (D/N)
Pause video look for increase in number of opaque pellets/flakes per volume (D/N)
Speed slide video to determine increase time (D/N) (Static Cameras)
Increase of snowflake size (D/N)
SNOW DECREASING
Slowing of opaque pellets/flakes accumulating on target/ground (D/N)
Wide view visibility increase (D/N)
Pause video look for decrease in number of opaque pellets/flakes per volume (D/N)
Speed slide video to determine decrease time (D/N) (Static Cameras)
Decrease of snowflake size (D/N)
SNOW ENDS
No more fall streaks (D/N)
No more accumulation (D/N)
Speed slide video to determine good end time (D/N)


, their expected performance after the improvements introduced in this project (dashed lines) and the expected performance of MAD-WRF (gren solid line).")


 plant at the Shagaya Renewable Energy Park in western Kuwait, with the new KISR research facility and the wind turbines in the background.")